Last updated: 2020-09-16
Checks: 7 0
Knit directory: baumarten/analysis/
This reproducible R Markdown analysis was created with workflowr (version 1.6.2). The Checks tab describes the reproducibility checks that were applied when the results were created. The Past versions tab lists the development history.
Great! Since the R Markdown file has been committed to the Git repository, you know the exact version of the code that produced these results.
Great job! The global environment was empty. Objects defined in the global environment can affect the analysis in your R Markdown file in unknown ways. For reproduciblity it’s best to always run the code in an empty environment.
The command set.seed(20200723) was run prior to running the code in the R Markdown file. Setting a seed ensures that any results that rely on randomness, e.g. subsampling or permutations, are reproducible.
Great job! Recording the operating system, R version, and package versions is critical for reproducibility.
Nice! There were no cached chunks for this analysis, so you can be confident that you successfully produced the results during this run.
Great job! Using relative paths to the files within your workflowr project makes it easier to run your code on other machines.
Great! You are using Git for version control. Tracking code development and connecting the code version to the results is critical for reproducibility.
The results in this page were generated with repository version 1bb6171. See the Past versions tab to see a history of the changes made to the R Markdown and HTML files.
Note that you need to be careful to ensure that all relevant files for the analysis have been committed to Git prior to generating the results (you can use wflow_publish or wflow_git_commit). workflowr only checks the R Markdown file, but you know if there are other scripts or data files that it depends on. Below is the status of the Git repository when the results were generated:
Ignored files:
    Ignored:    .Rhistory
    Ignored:    .Rproj.user/
    Ignored:    analysis/.Rhistory
    Ignored:    data/sen2/

Untracked files:
    Untracked:  baumarten_viz.qgz

Unstaged changes:
    Deleted:    analysis/evaluation.Rmd
    Deleted:    analysis/probability.Rmd
    Modified:   code/workflow_project_setup.R
Note that any generated files, e.g. HTML, png, CSS, etc., are not included in this status report because it is ok for generated content to have uncommitted changes.
These are the previous versions of the repository in which changes were made to the R Markdown (analysis/class_reduction.Rmd) and HTML (docs/class_reduction.html) files. If you’ve configured a remote Git repository (see ?wflow_git_remote), click on the hyperlinks in the table below to view the files as they were in that past version.
| File | Version | Author | Date | Message |
|---|---|---|---|---|
| Rmd | 1bb6171 | wiesehahn | 2020-09-16 | Publish all files for myproject |
| html | 0dc5644 | wiesehahn | 2020-09-08 | Build site. |
| Rmd | 30d98a7 | wiesehahn | 2020-09-08 | Change filenames, add analysis |
Class reduction
Background
As we saw in the part about Model Tuning there is no significant impact by haperparameter settings or the predictor variables. However, the performance varies between species. As we can see in the following table douglas fir, pine and larch have much lower prediction accuracies than beech or spruce. This might be related to a lower number of reference data but it might also come from correlated reflectancies.
| Balanced Accuracy | |
|---|---|
| Class: BU | 0.9502580 |
| Class: DGL | 0.8910167 |
| Class: FI | 0.9721655 |
| Class: KI | 0.9166467 |
| Class: LAE | 0.9034690 |
| Class: TEI | 0.9454064 |
Question
What happens to prediction accuracies if the number of predicted tree species is reduced?
To test this a model was trained on just four species (beech, spruce, pine, oak) excluding larch and douglas fir, since the 6-class model performs bad for them and additionally they have a low abundance.
Results
Accuracy
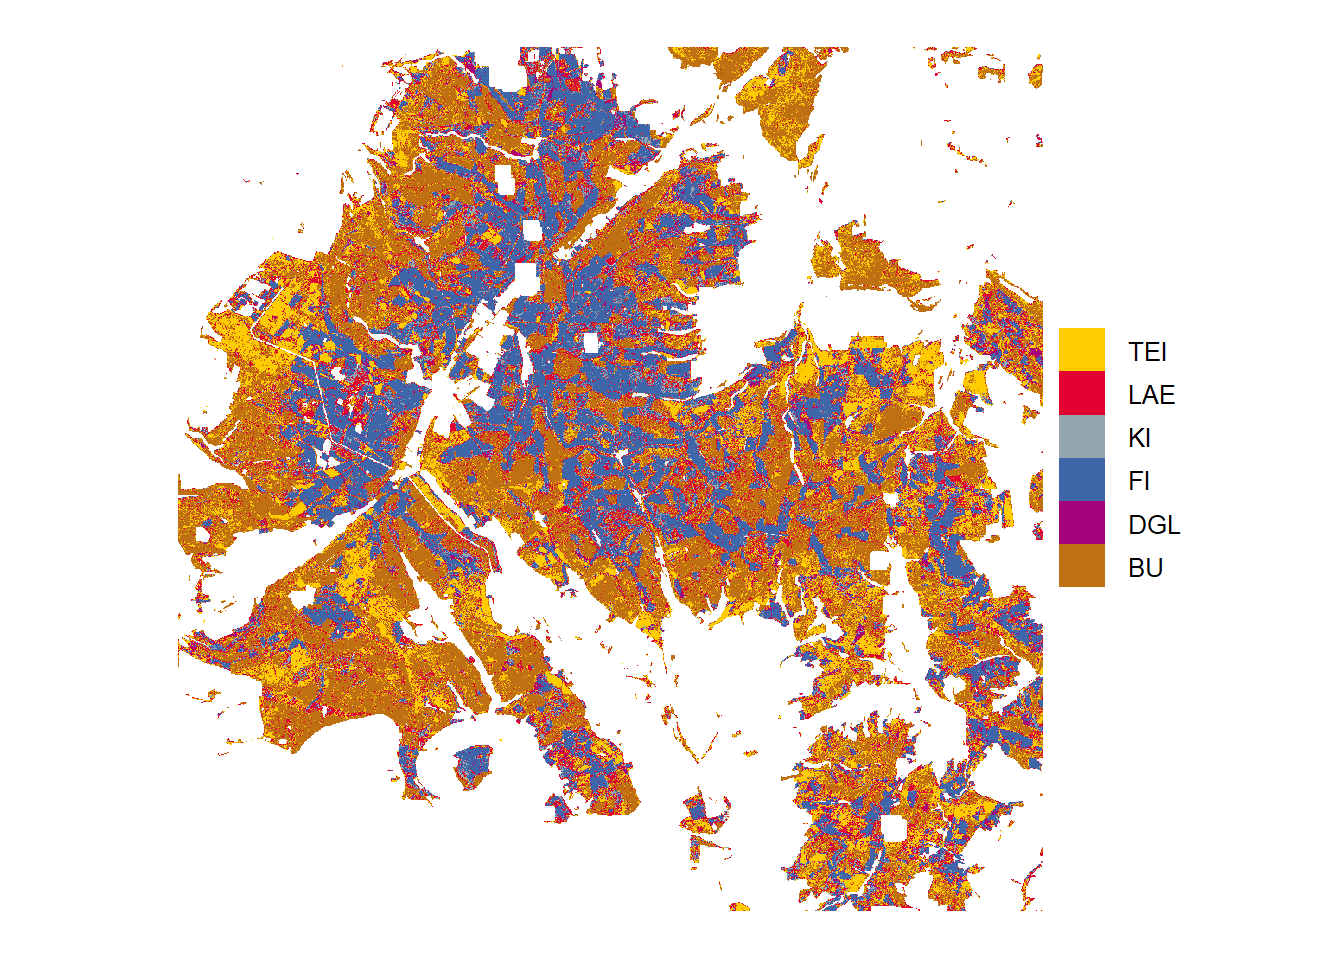
The effect of less prediction classes in the RF model can be seen below. Because the model is trained on 4 classes excluding larch and douglas fir, none of the reference pixels is classified as one of those. Including all 6 tree species in the validation dataset we can see, that Douglas fir is mainly classified as Spruce, while Larch is classified as either Beech, Pine or Oak!
Error Matrix| Baumart | BU | DGL | FI | KI | LAE | TEI |
|---|---|---|---|---|---|---|
| BU | 2308 | 2 | 8 | 4 | 356 | 148 |
| DGL | 0 | 0 | 0 | 0 | 0 | 0 |
| FI | 0 | 394 | 2786 | 22 | 55 | 1 |
| KI | 16 | 97 | 49 | 538 | 307 | 2 |
| LAE | 0 | 0 | 0 | 0 | 0 | 0 |
| TEI | 83 | 35 | 5 | 4 | 251 | 1673 |
| Accuracy | Kappa | AccuracyLower | AccuracyUpper |
|---|---|---|---|
| 0.7988845 | 0.7340012 | 0.7905195 | 0.8070587 |
| Accuracy | Kappa | AccuracyLower | AccuracyUpper |
|---|---|---|---|
| 0.9552766 | 0.936171 | 0.9504019 | 0.9598003 |
| Balanced Accuracy | |
|---|---|
| Class: BU | 0.9641678 |
| Class: DGL | NA |
| Class: FI | 0.9867188 |
| Class: KI | 0.9688592 |
| Class: LAE | NA |
| Class: TEI | 0.9507077 |
Compared to the 6-class model accuracies for all four species increased. Especially the accuracy for pine increased a lot.
By region
The classification probabilities for each class and the final predictions were calculated for study sites to compare the 6-class and the 4-class model visually.
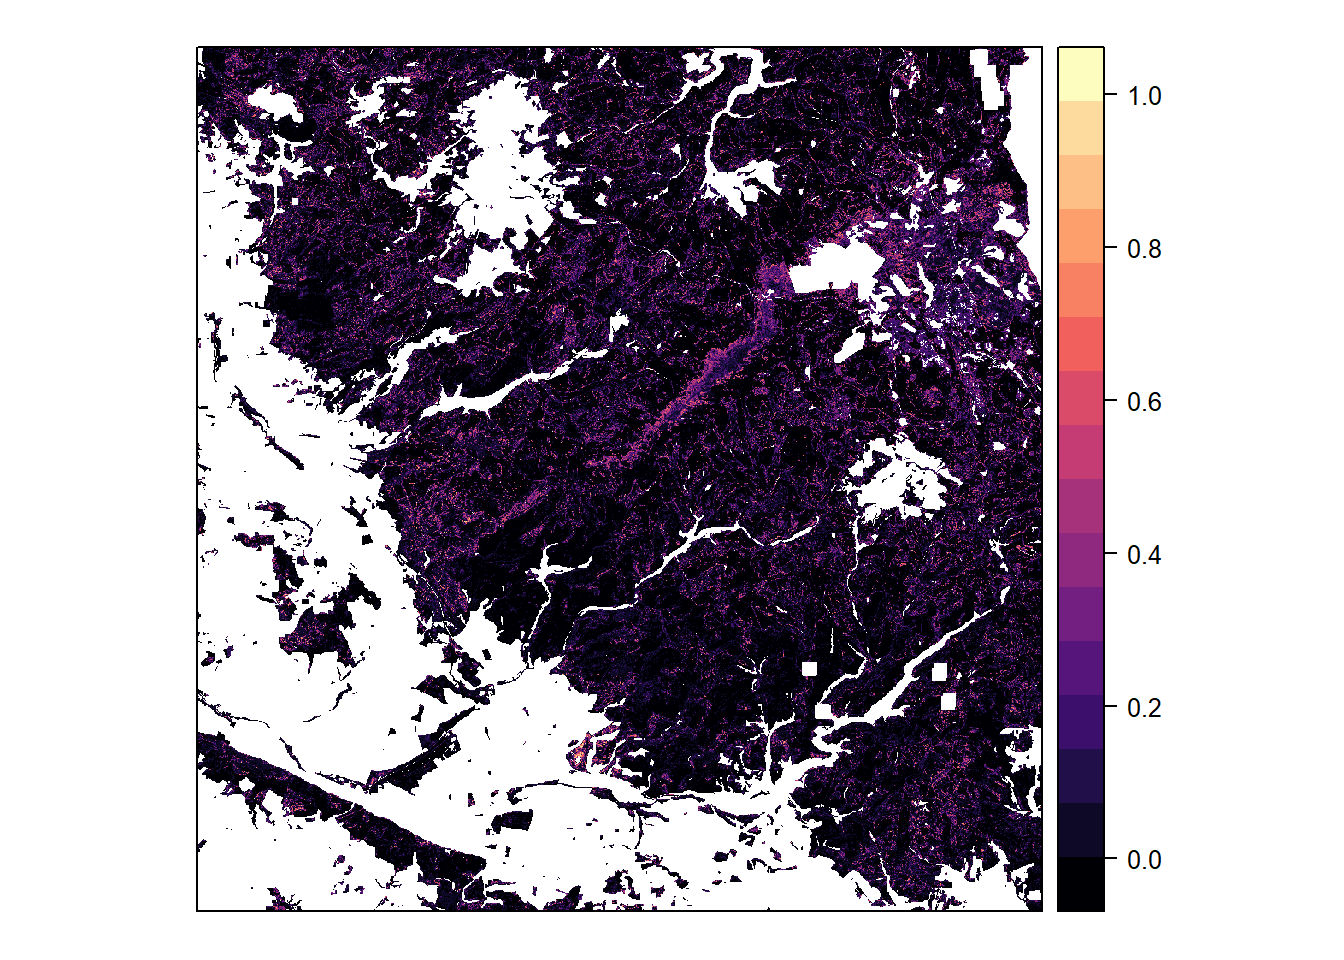
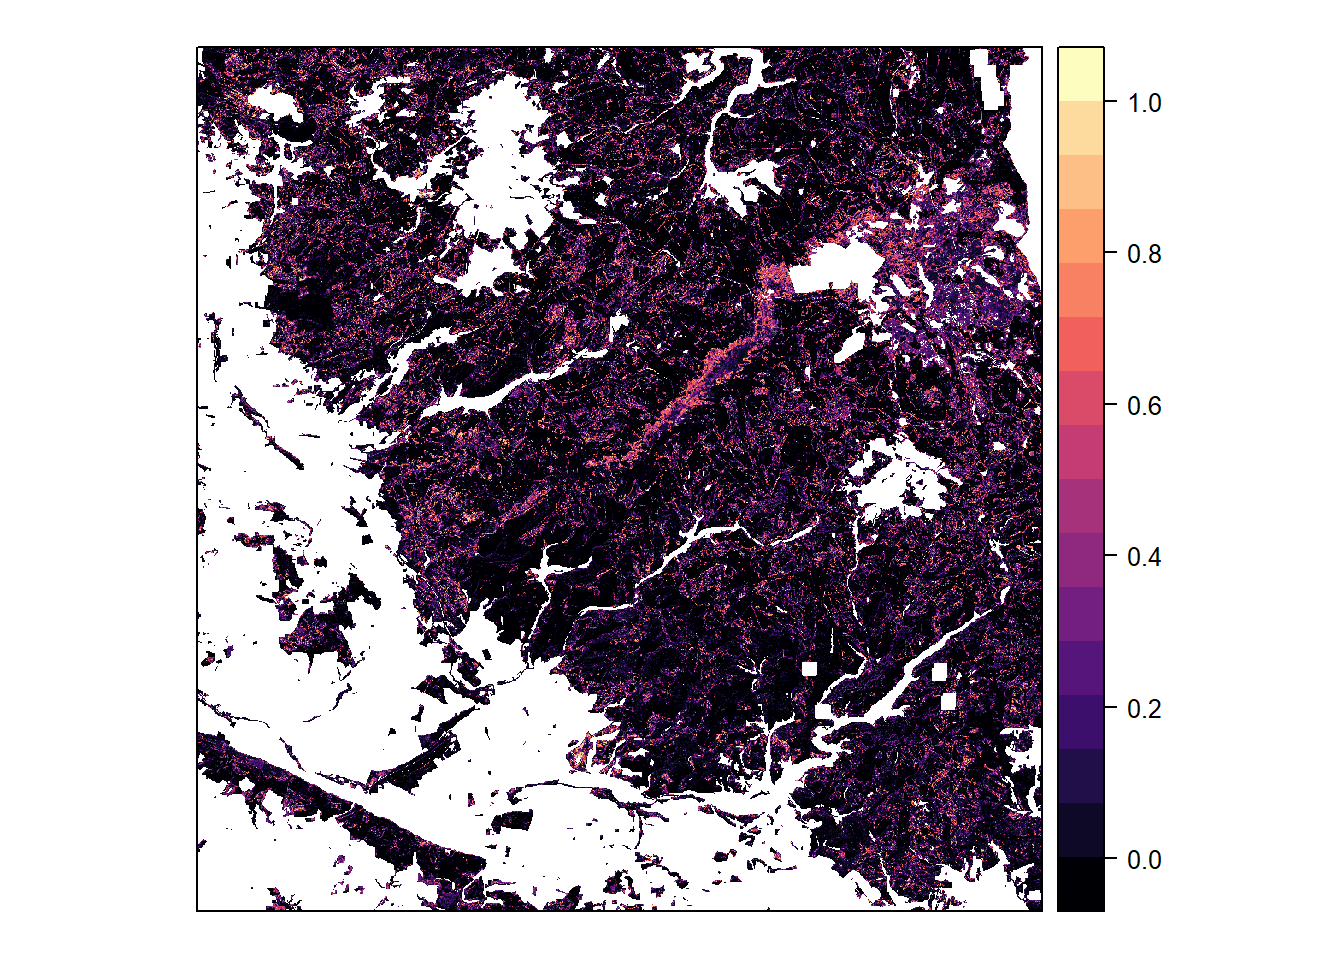
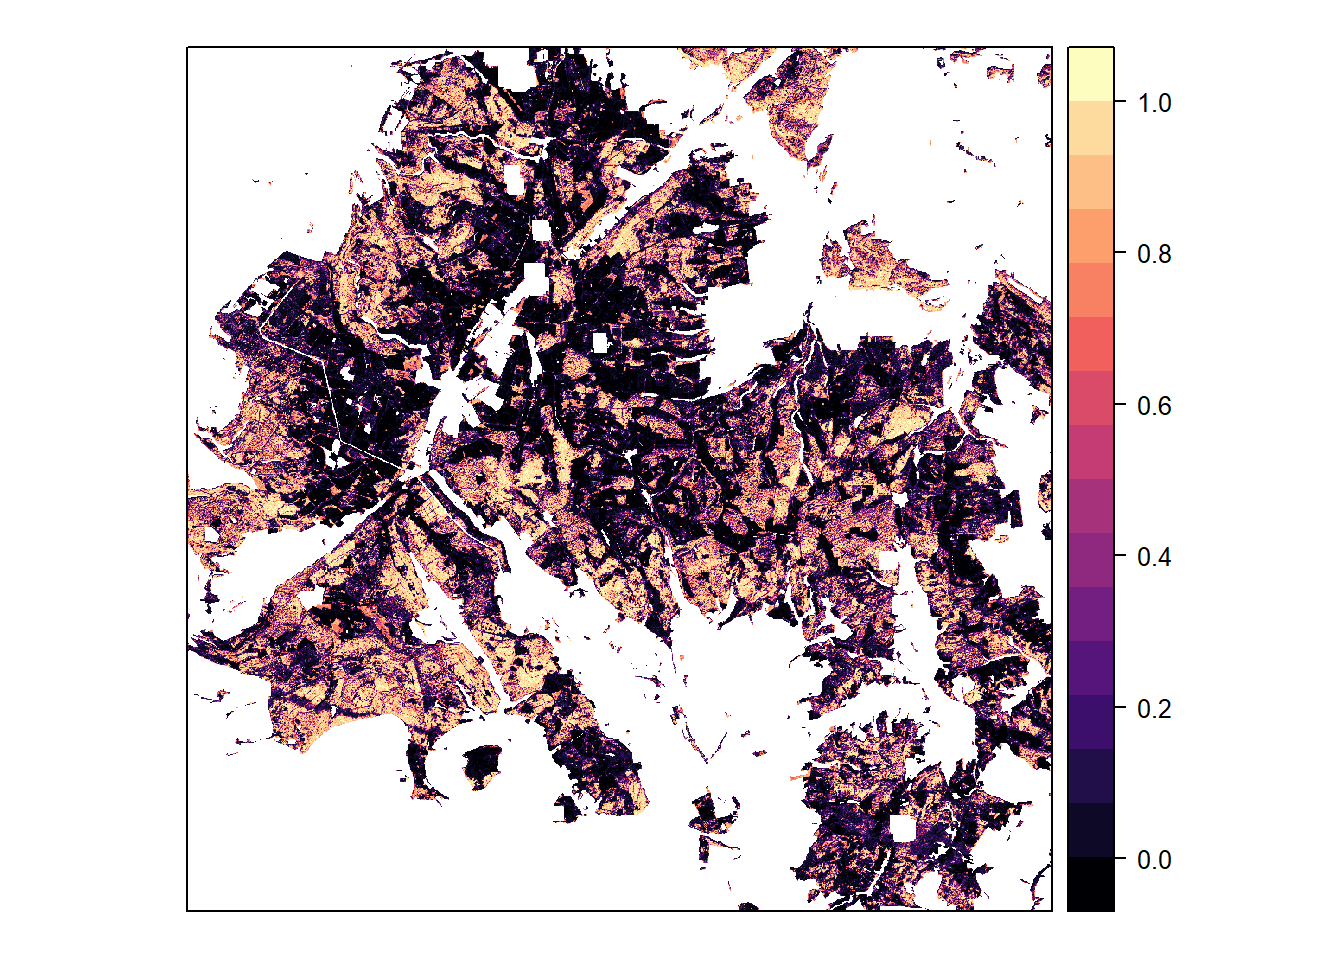
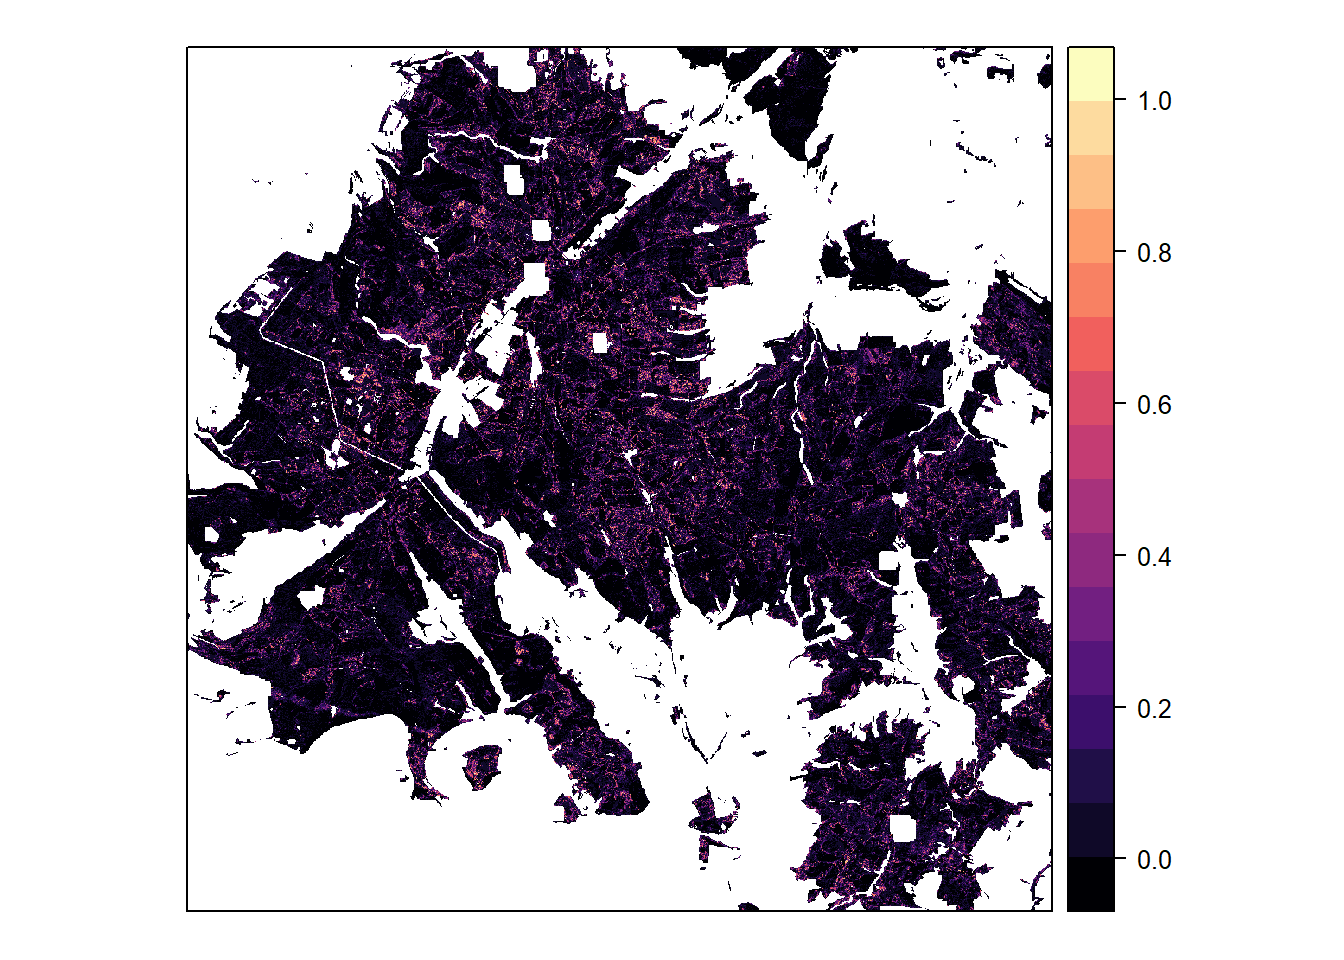
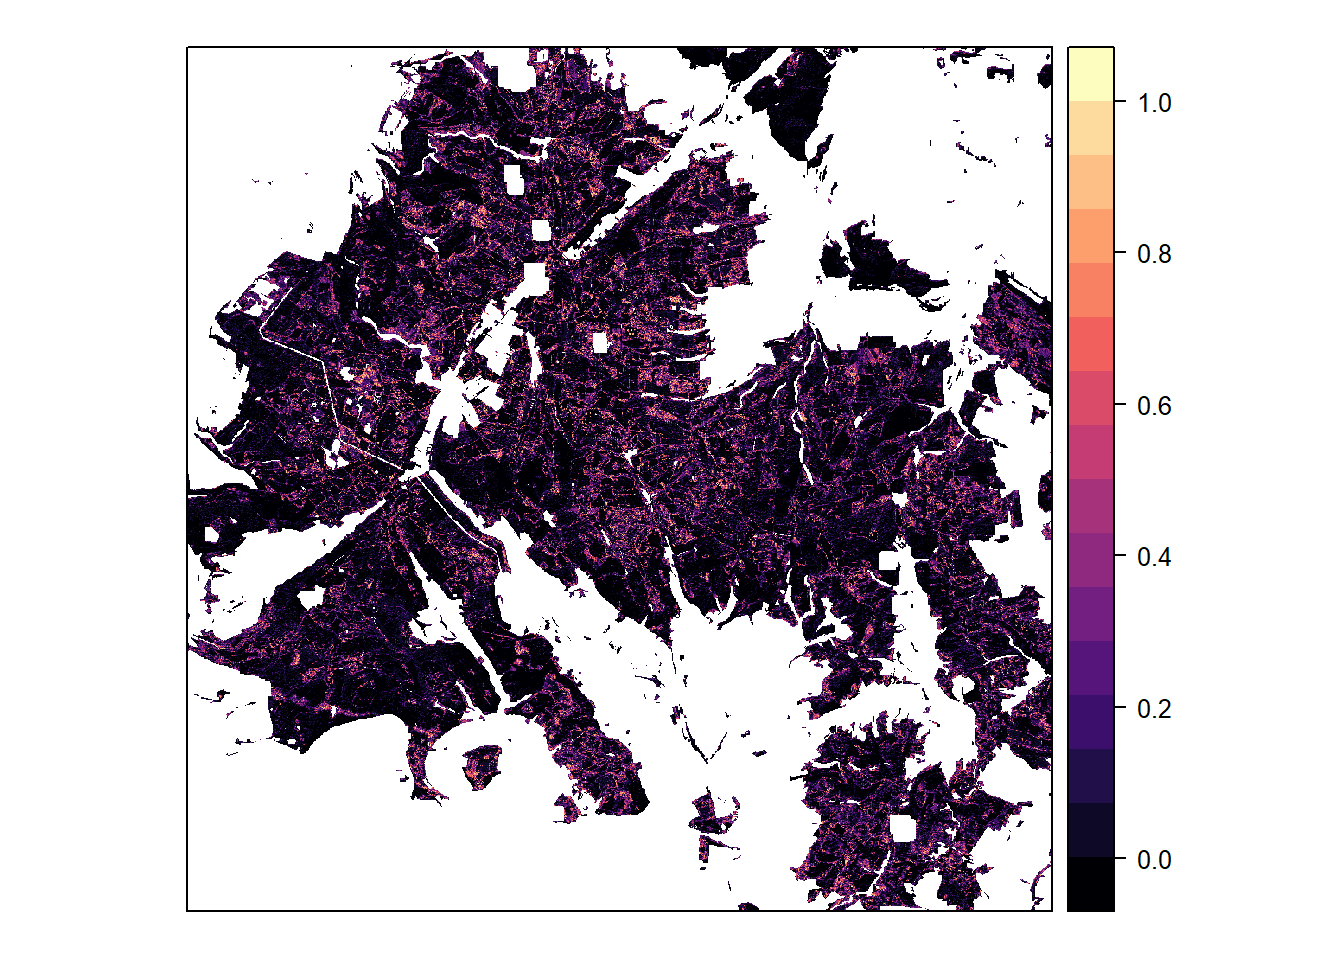
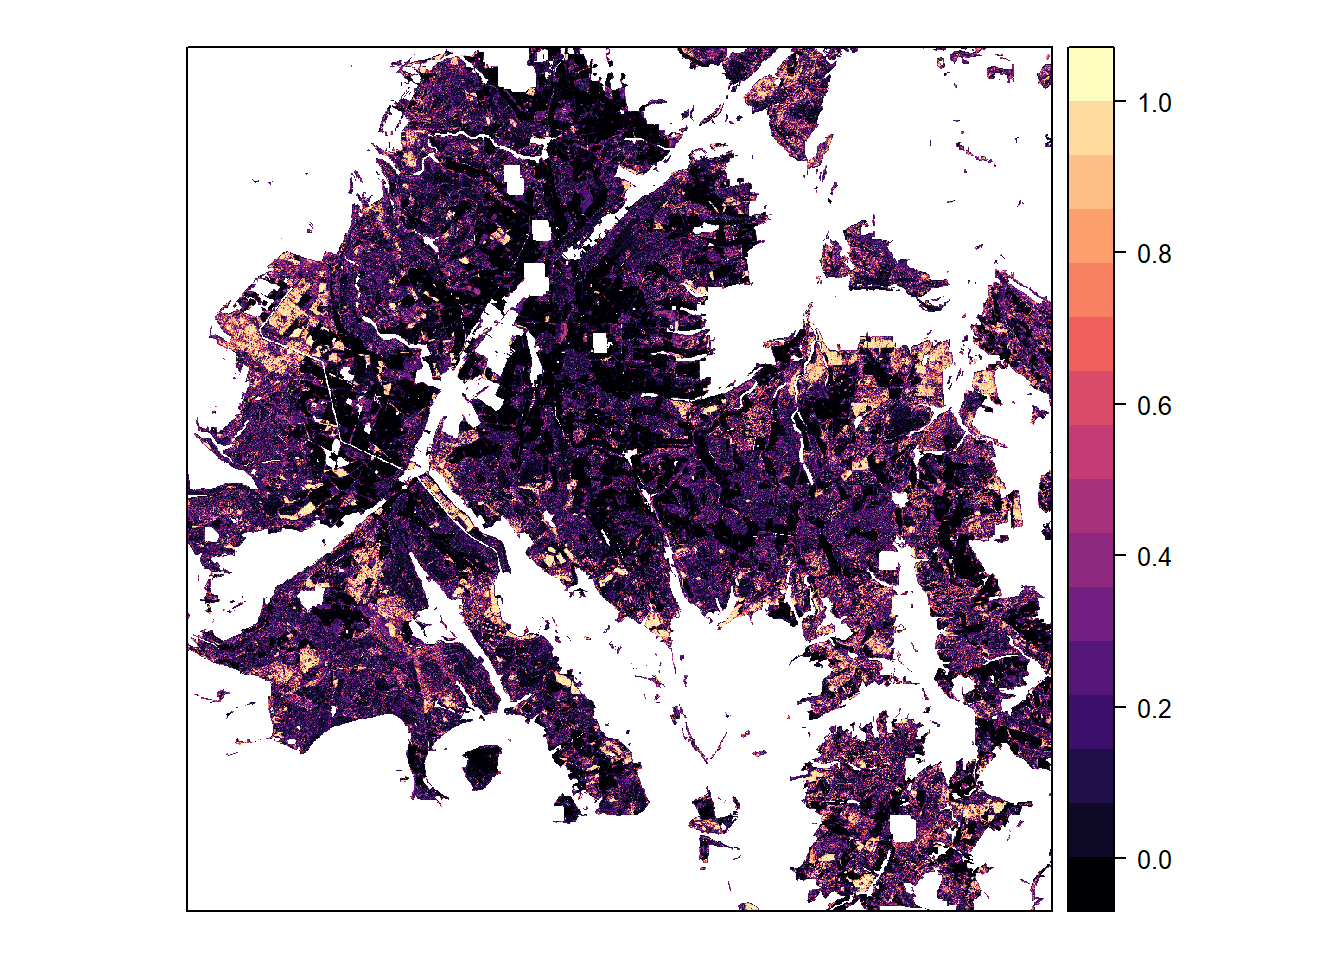
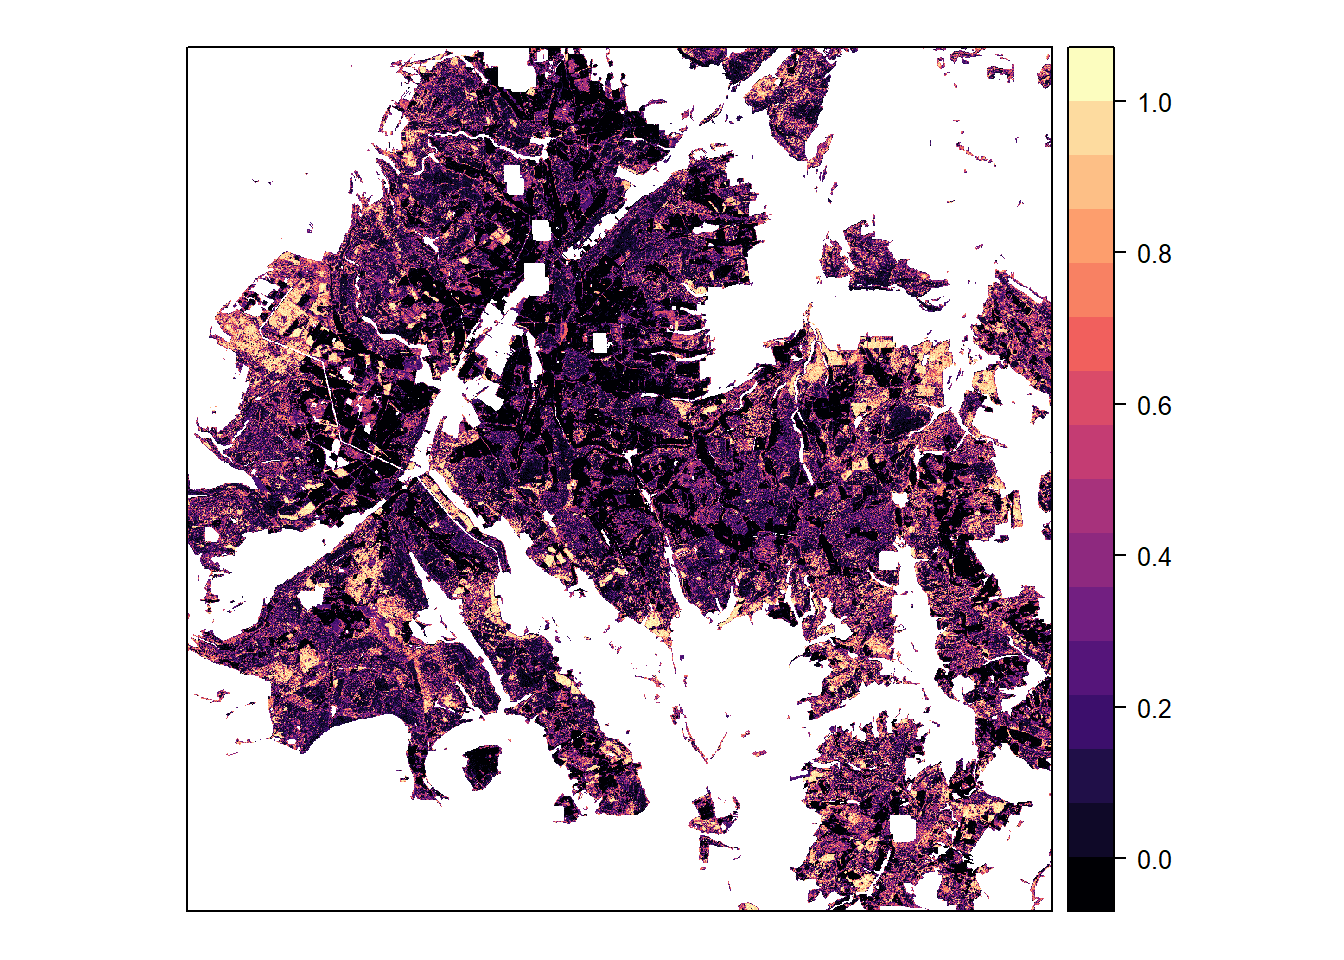
Harz
Tree species probabilities and final classification in the Harz area.
Beech
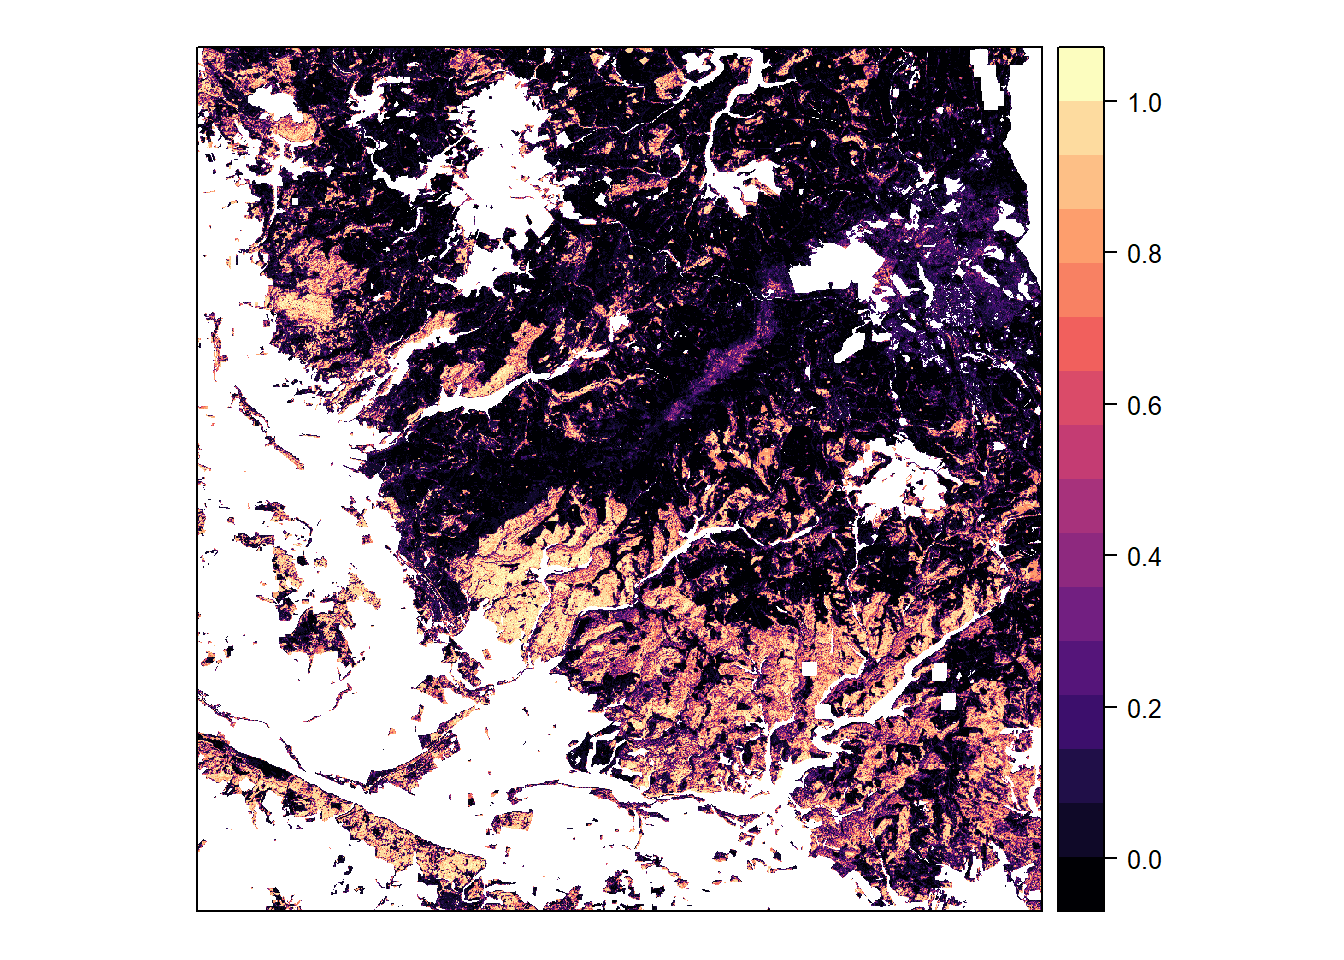
Classification probabilities for beech, based on 6-class model
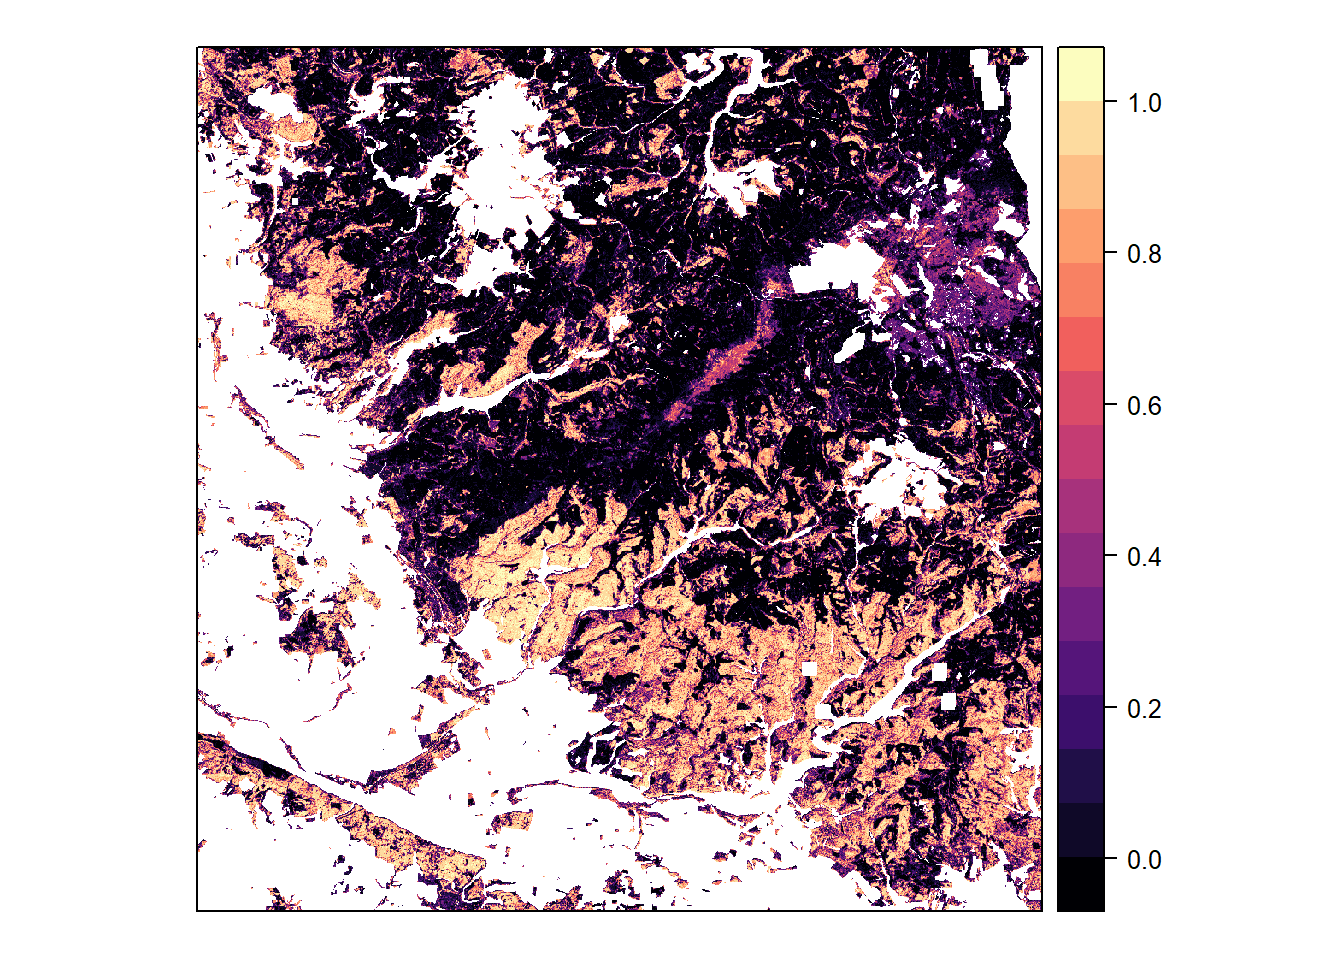
Classification probabilities for beech, based on 4-class model
Spruce
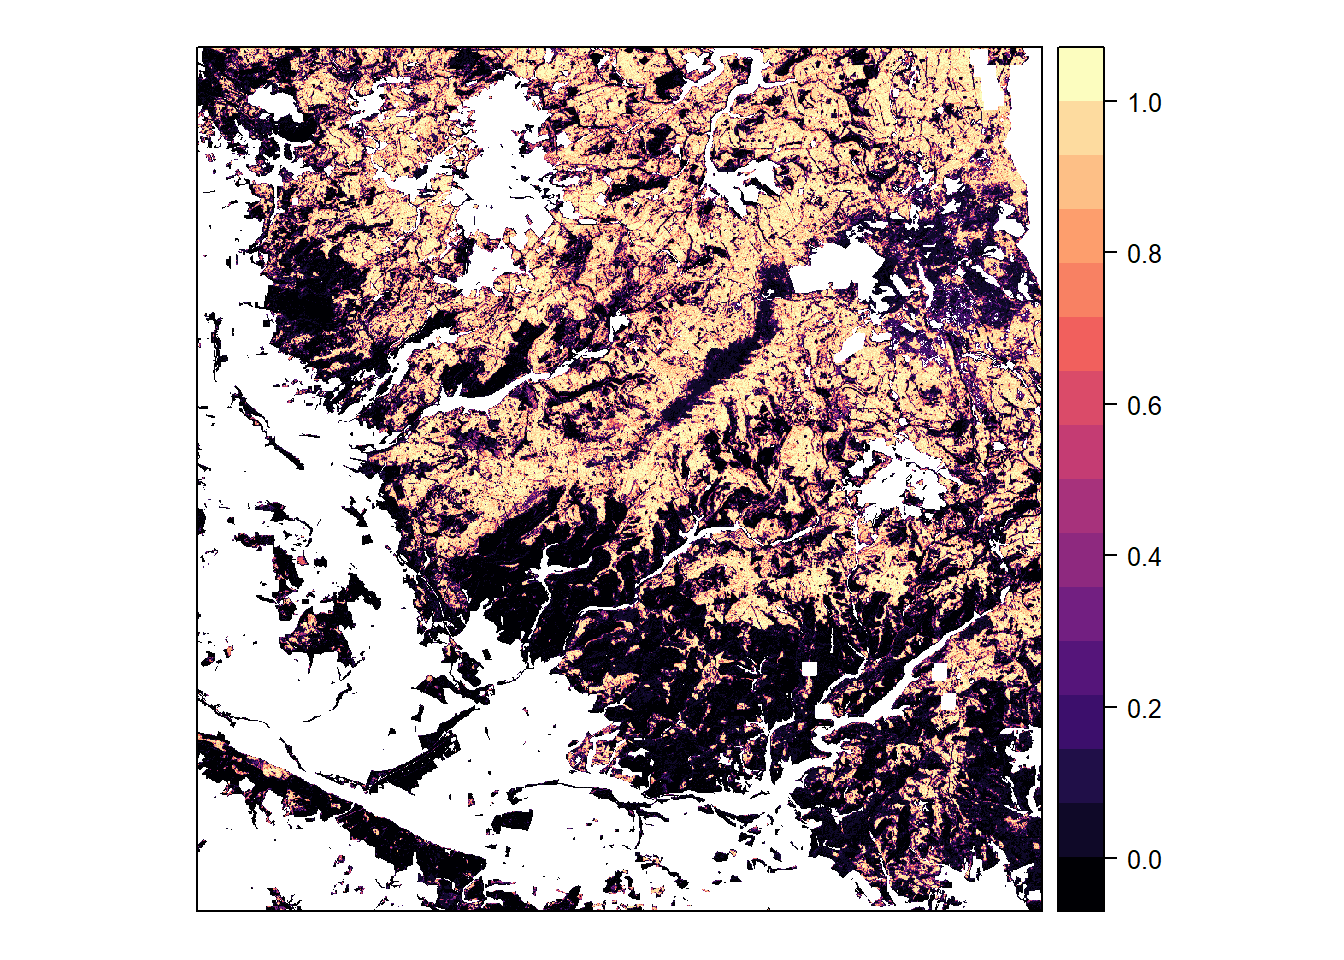
Classification probabilities for spruce, based on 6-class model
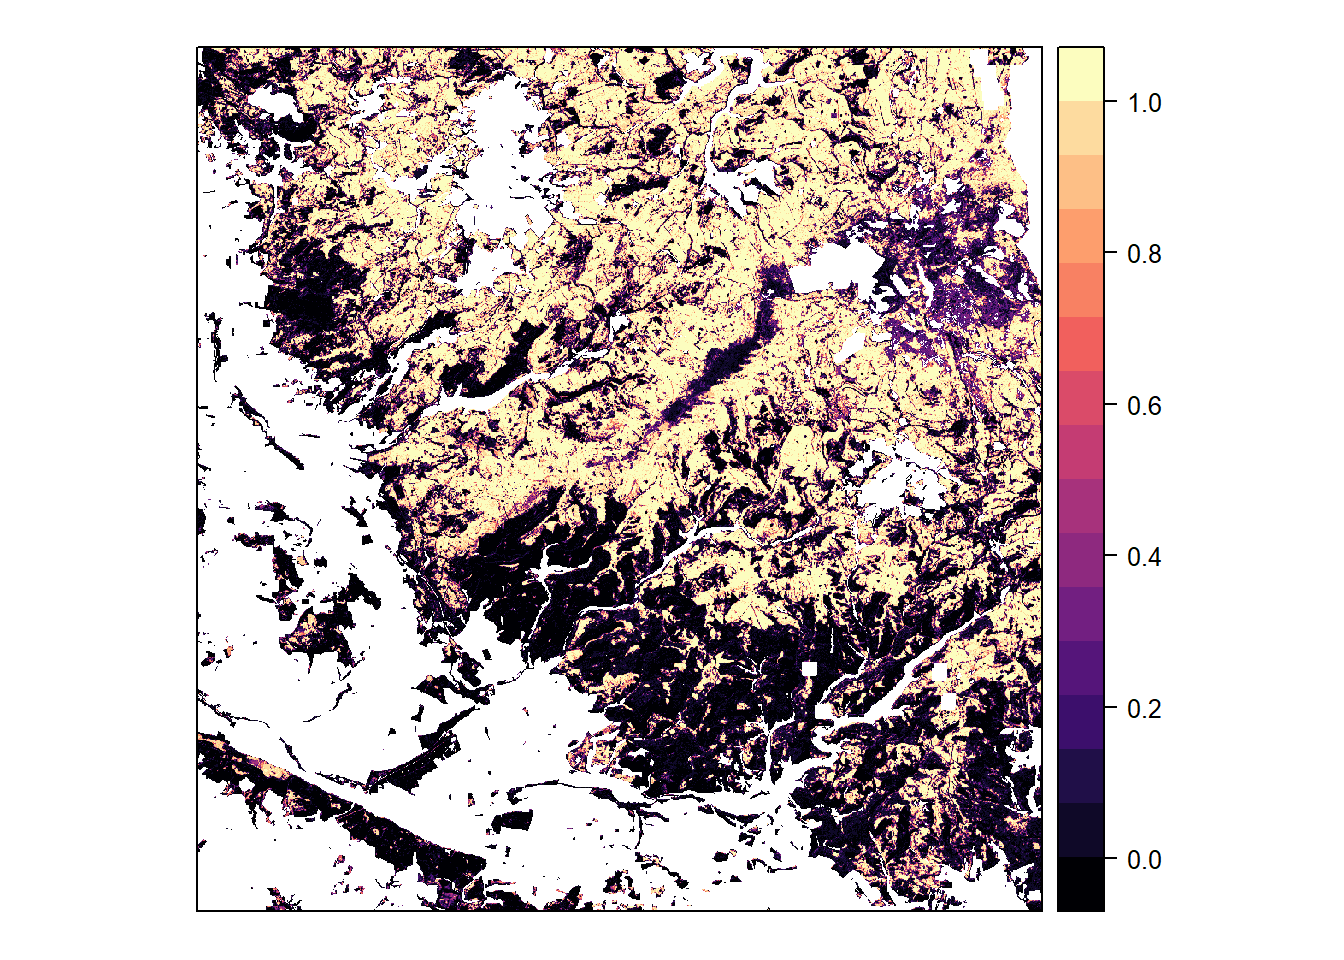
Classification probabilities for spruce, based on 4-class model
Pine
Classification probabilities for pine, based on 6-class model
Classification probabilities for pine, based on 4-class model
Oak
Classification probabilities for oak, based on 6-class model
Classification probabilities for oak, based on 4-class model
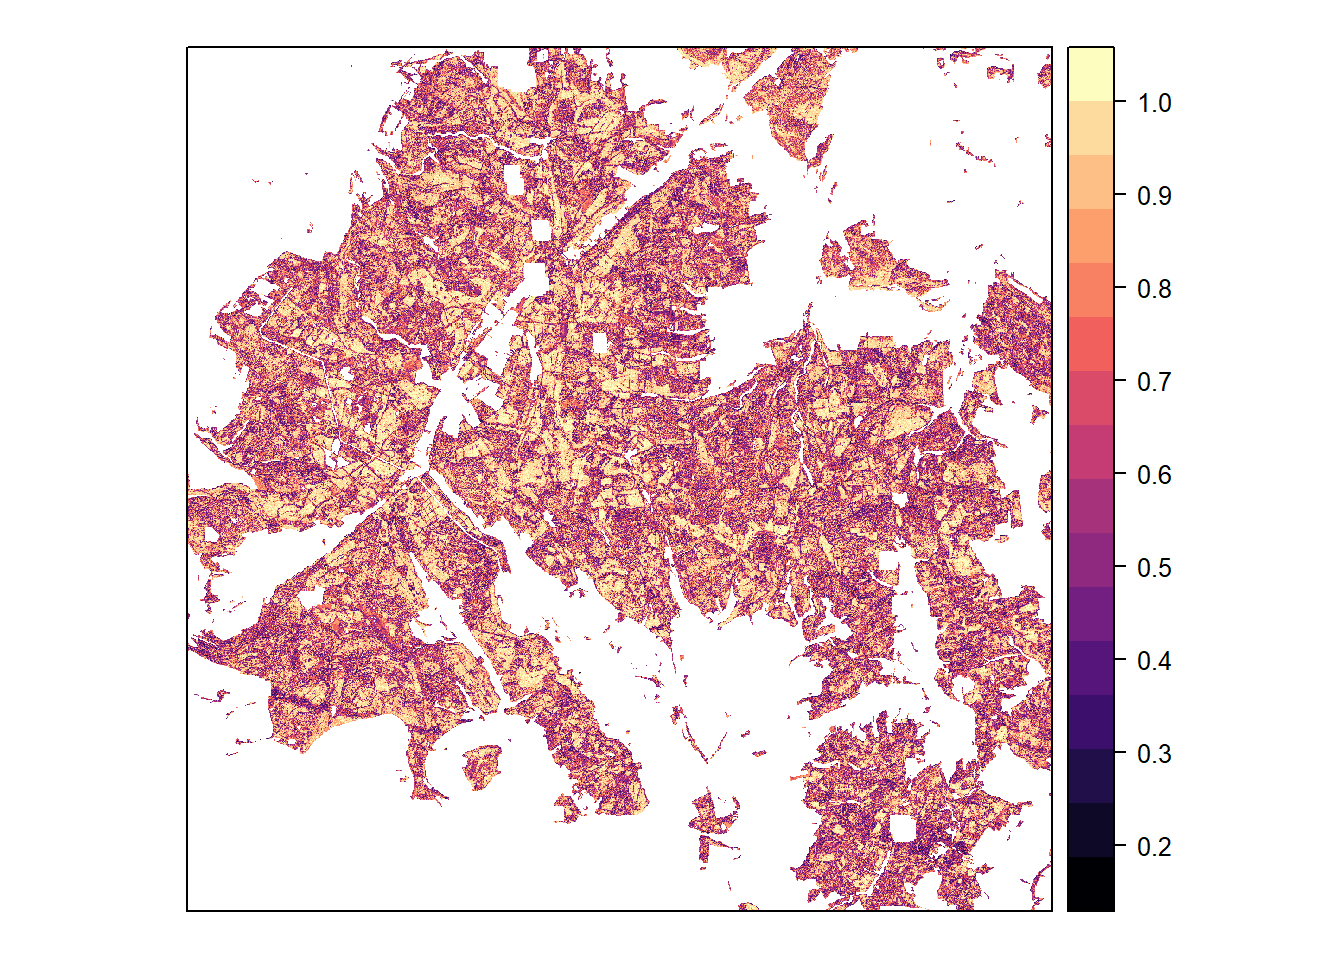
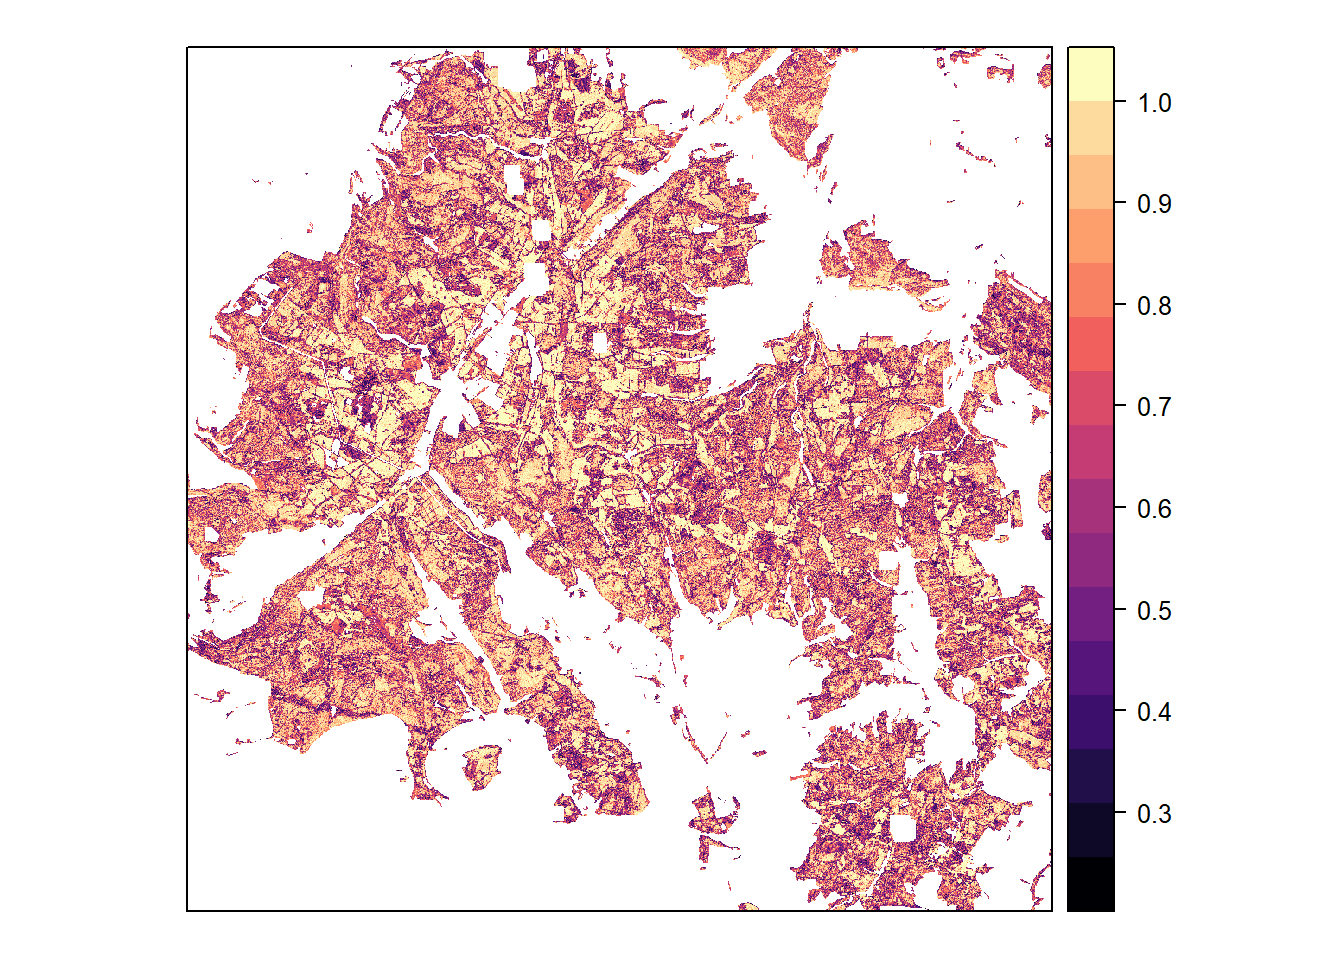
Maximum
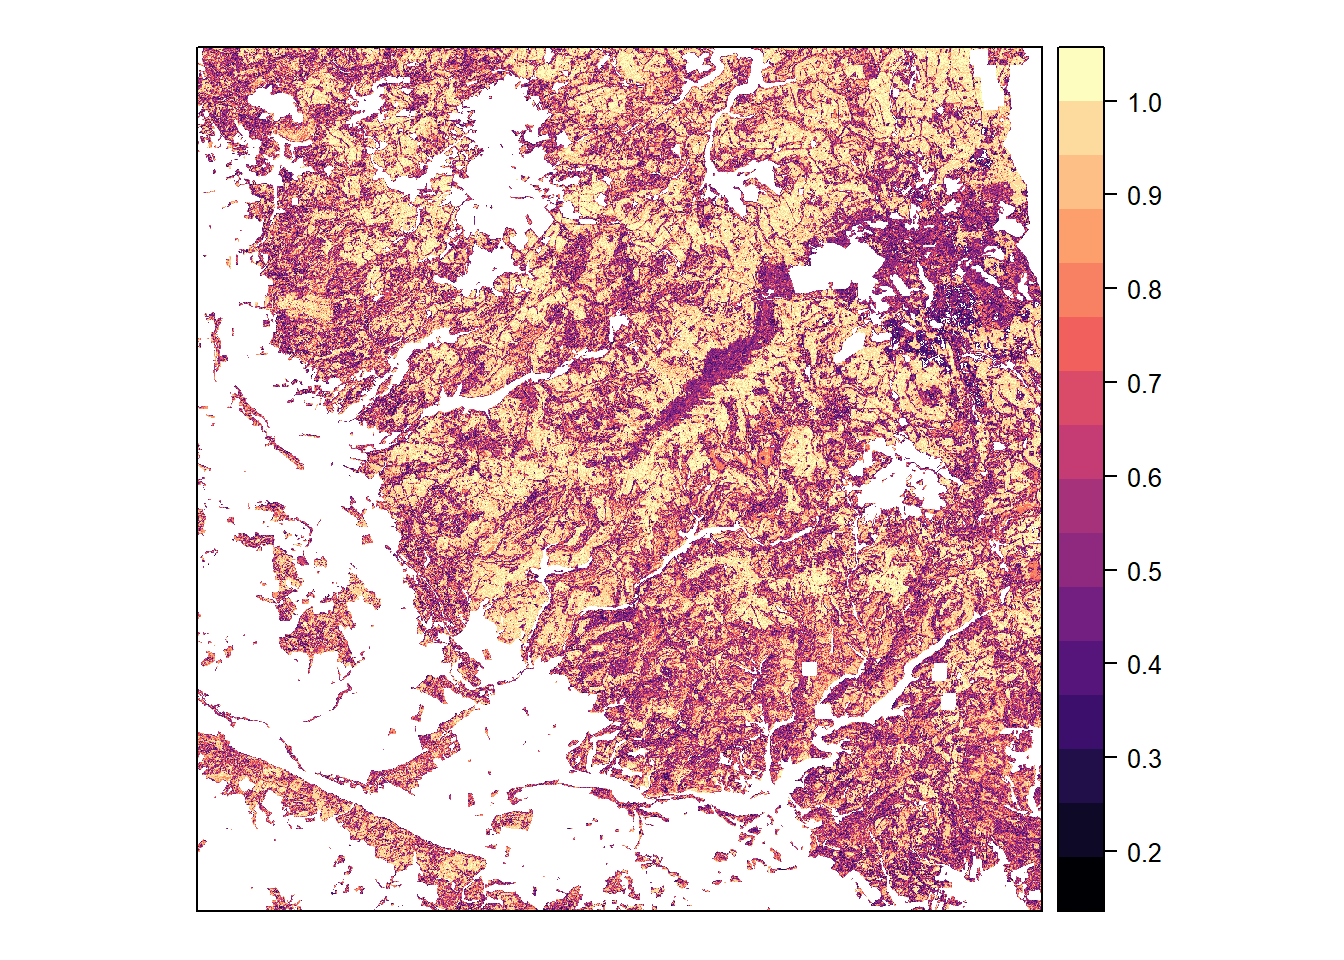
Maximum classification probabilitiy, based on 6-class model
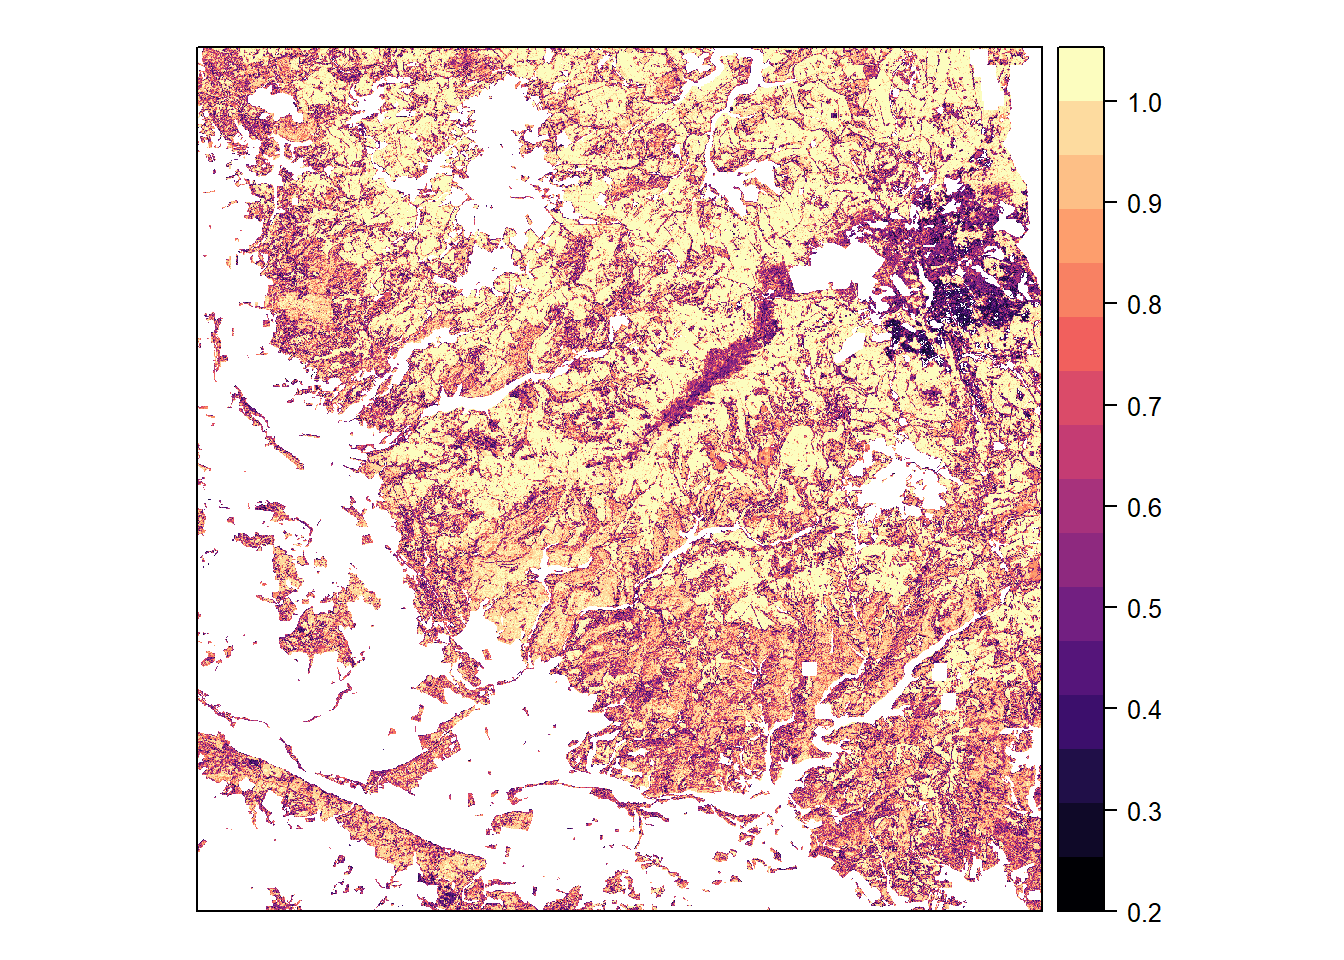
Maximum classification probability, based on 4-class model
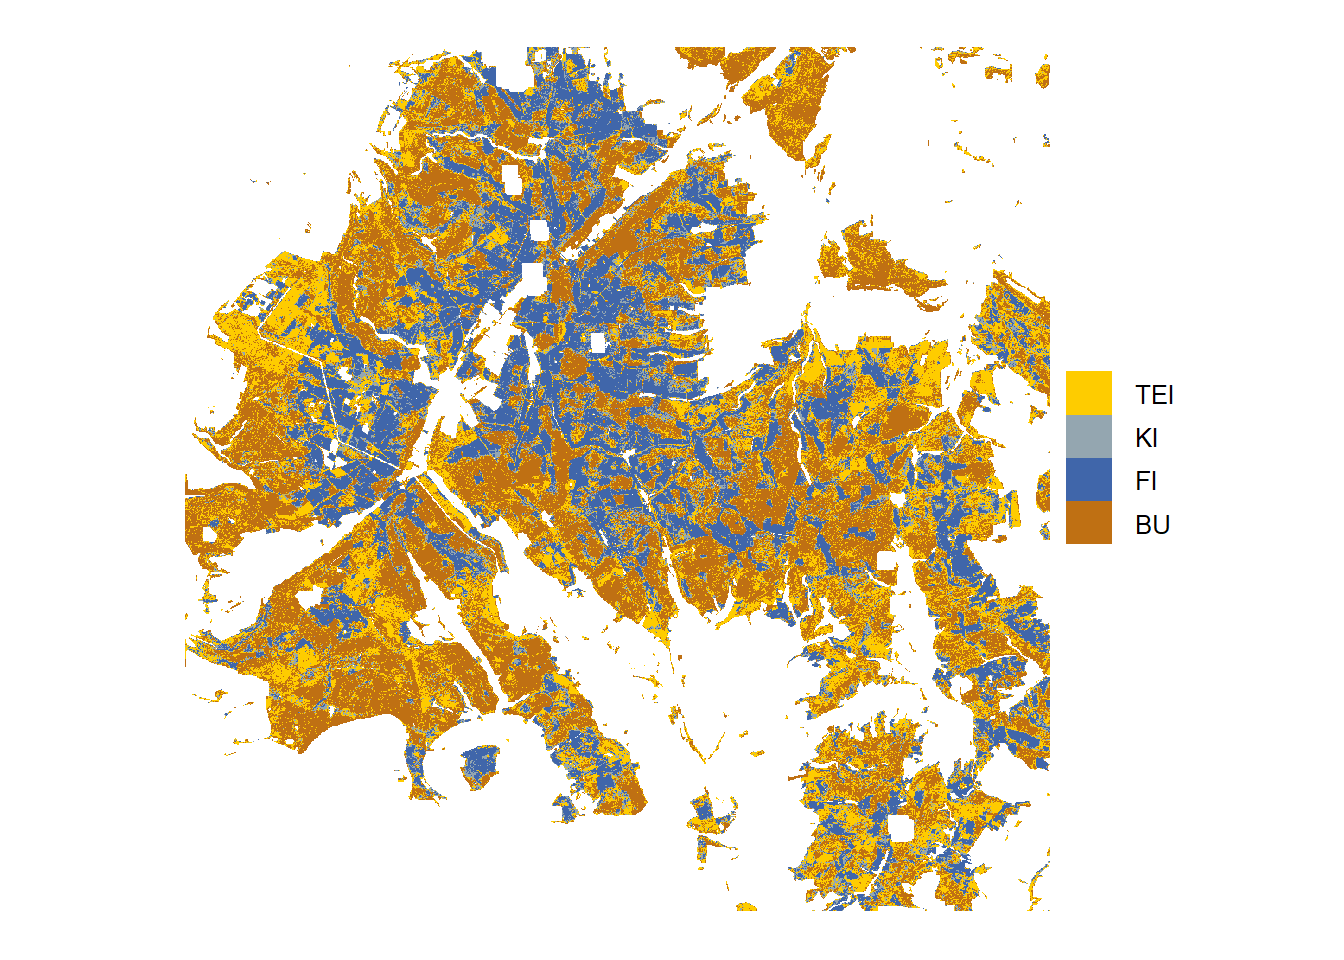
Classification
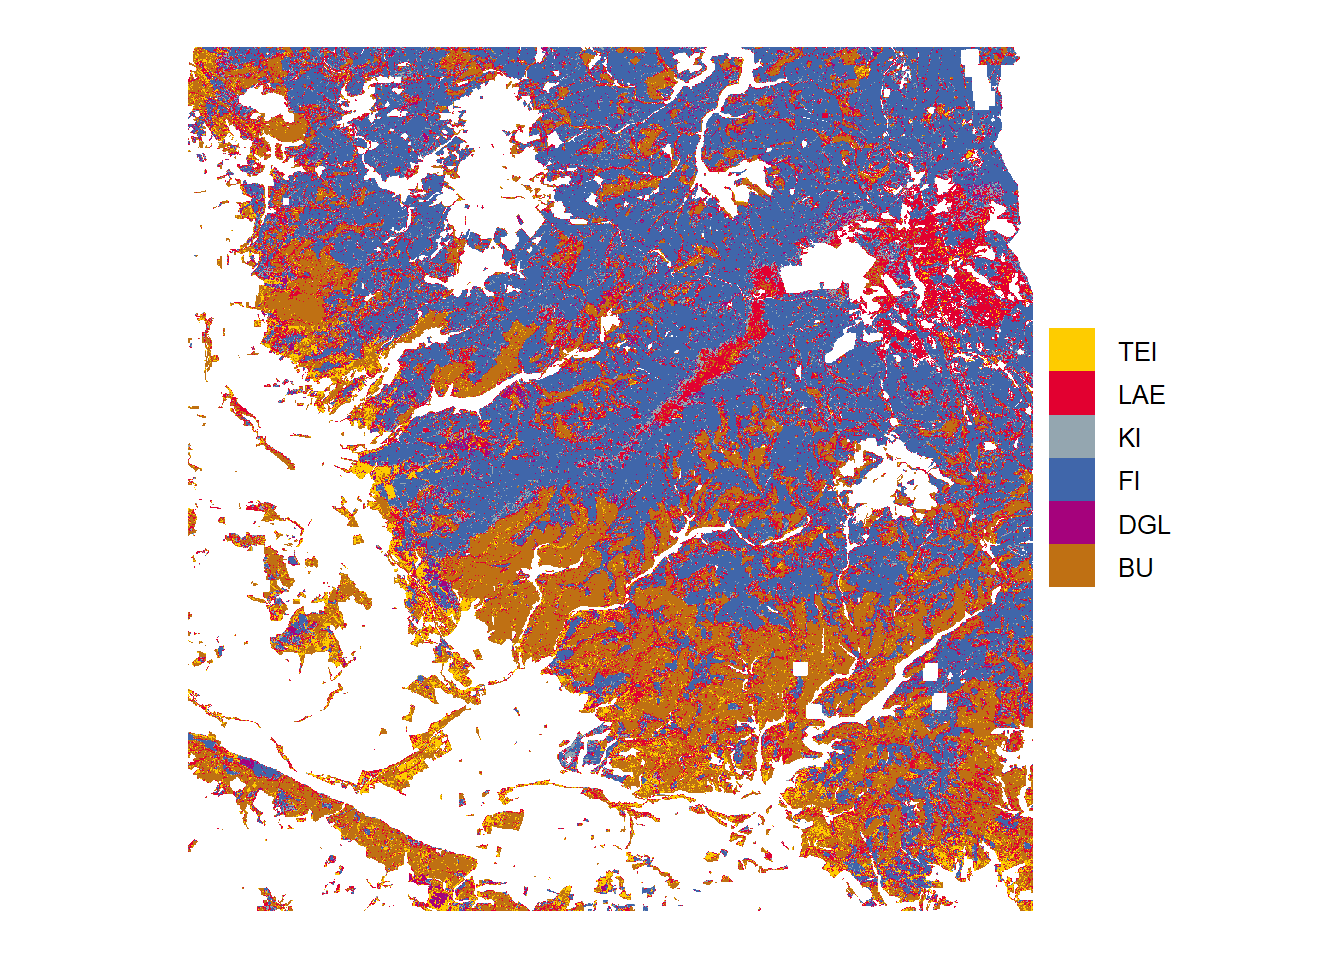
Tree species predition, based on 6-class model
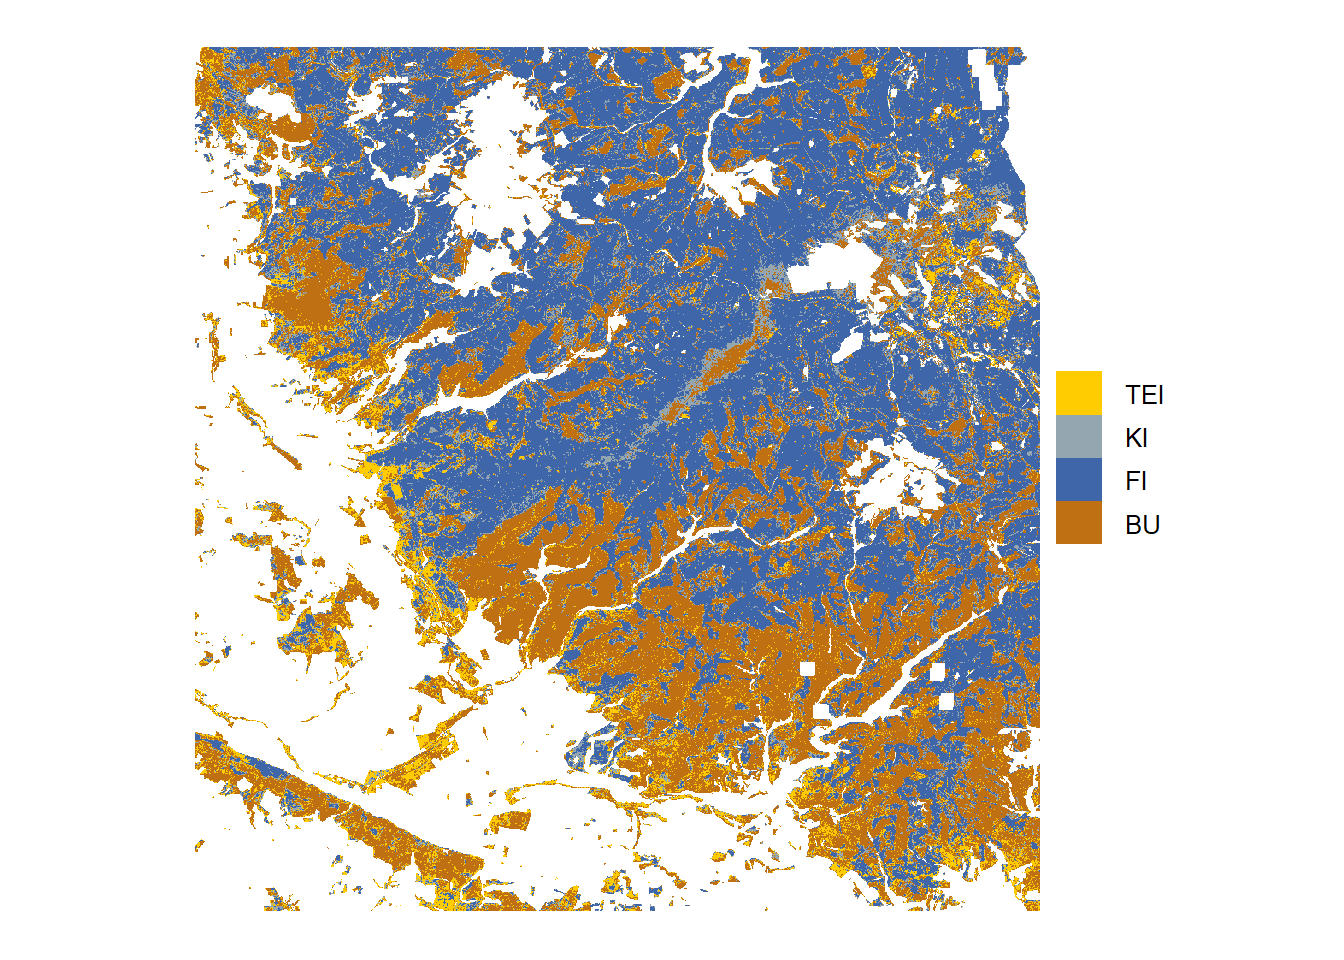
Tree species predition, based on 4-class model
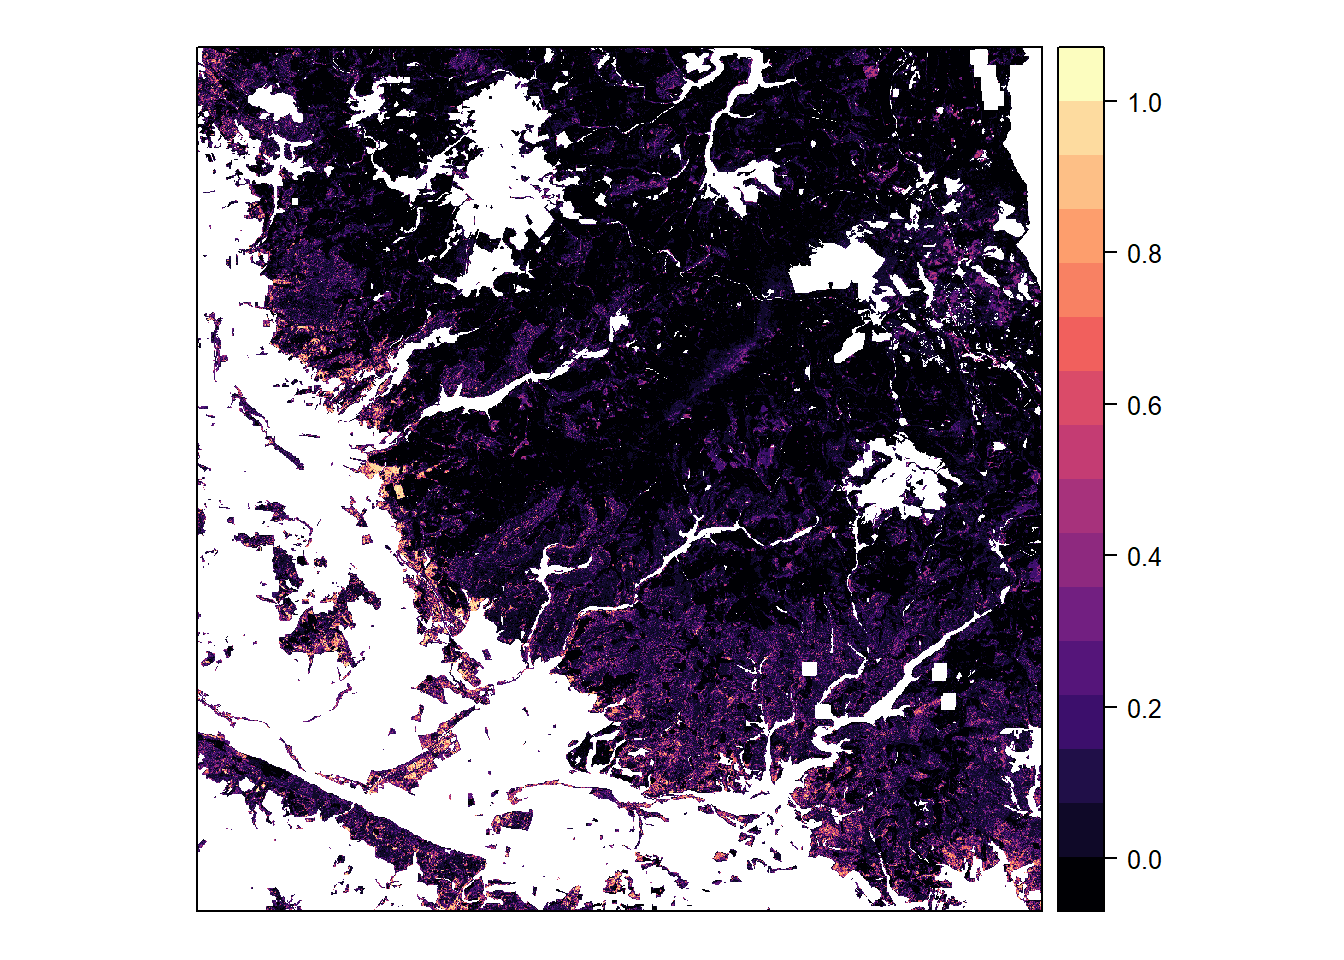
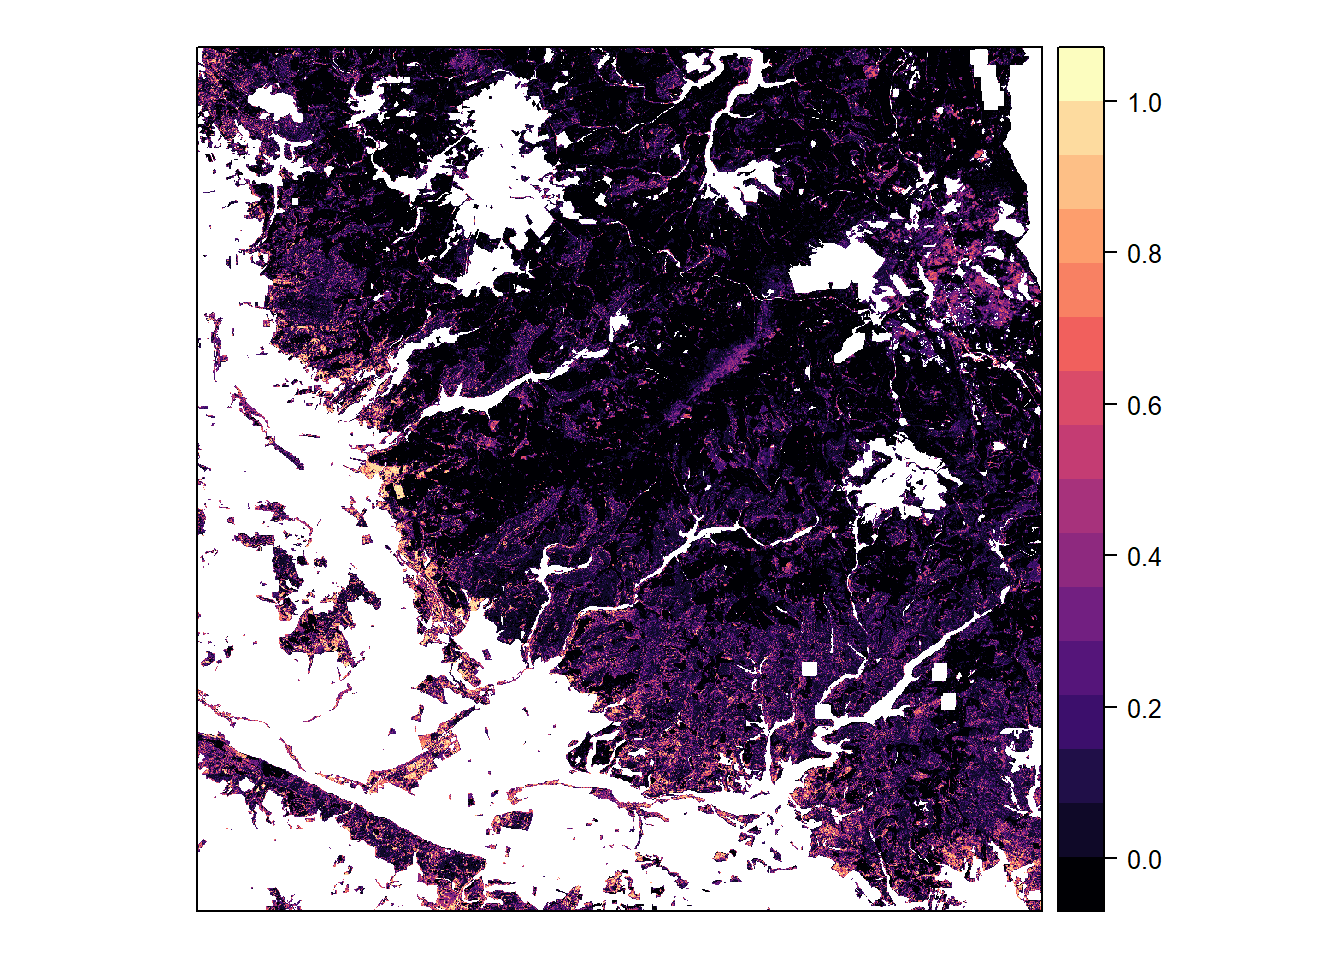
Solling
Tree species probabilities and final classification in the Solling area.
Beech
Classification probabilities for beech, based on 6-class model
Classification probabilities for beech, based on 4-class model
Spruce
Classification probabilities for spruce, based on 6-class model
Classification probabilities for spruce, based on 4-class model
Pine
Classification probabilities for pine, based on 6-class model
Classification probabilities for pine, based on 4-class model
Oak
Classification probabilities for oak, based on 6-class model
Classification probabilities for oak, based on 4-class model
Maximum
Maximum classification probabilitiy, based on 6-class model
Maximum classification probability, based on 4-class model
Classification
Tree species predition, based on 6-class model
Tree species predition, based on 4-class model
Prediction probability
Overall
The average prediction certainty is higher with the 4-class model than with the 6-class model in the Solling area (0.78 vs. 0.74) and in the Harz area (0.82 vs. 0.74).
6-class
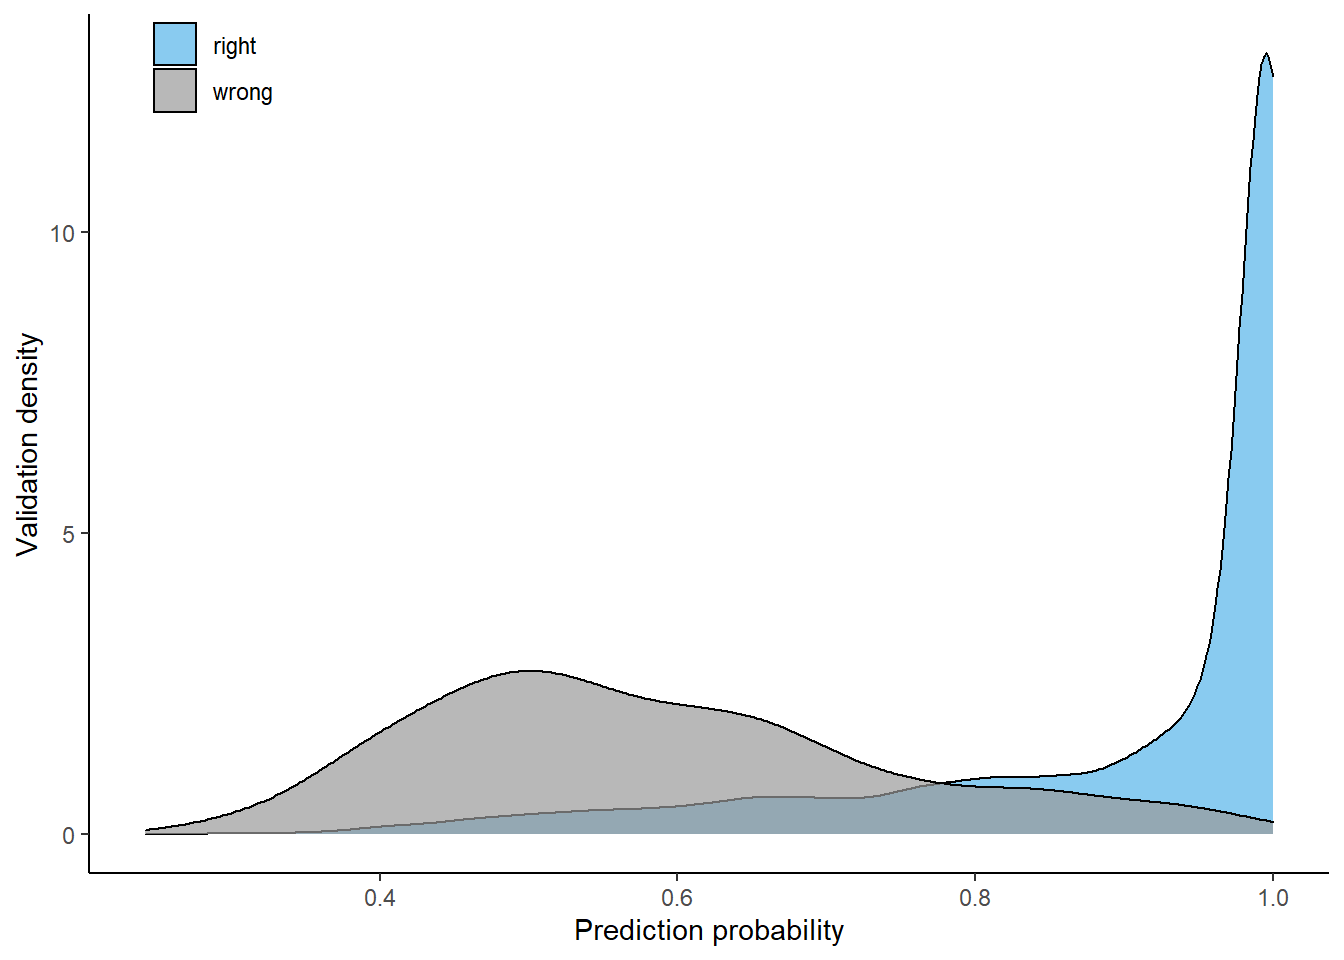
Relative distributions of prediction probabilities by tree species, using the 6-class model
4-class
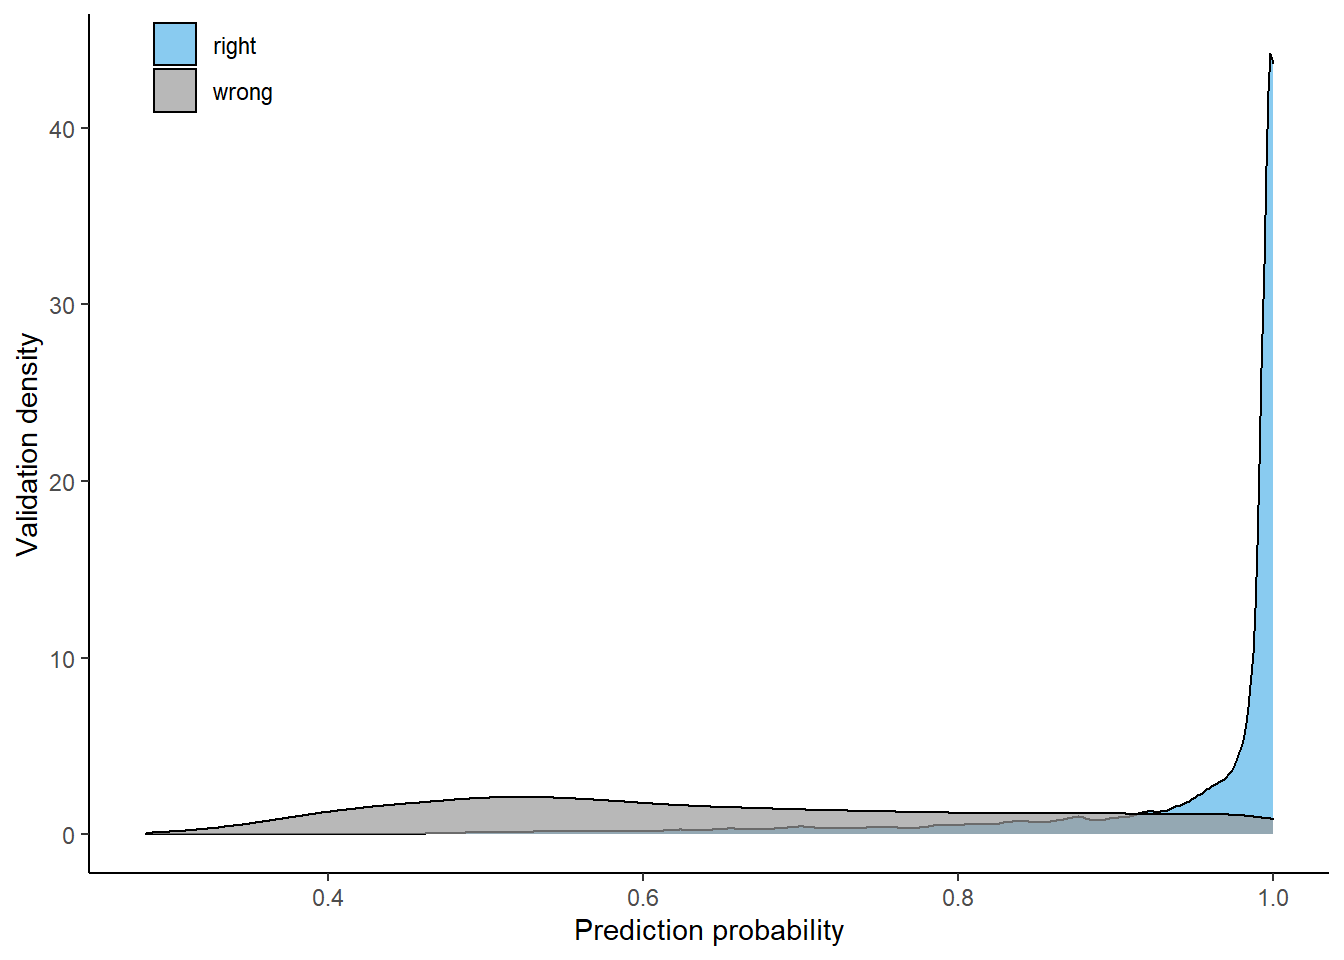
Relative distributions of prediction probabilities by tree species, using the 6-class model
By species
6-class
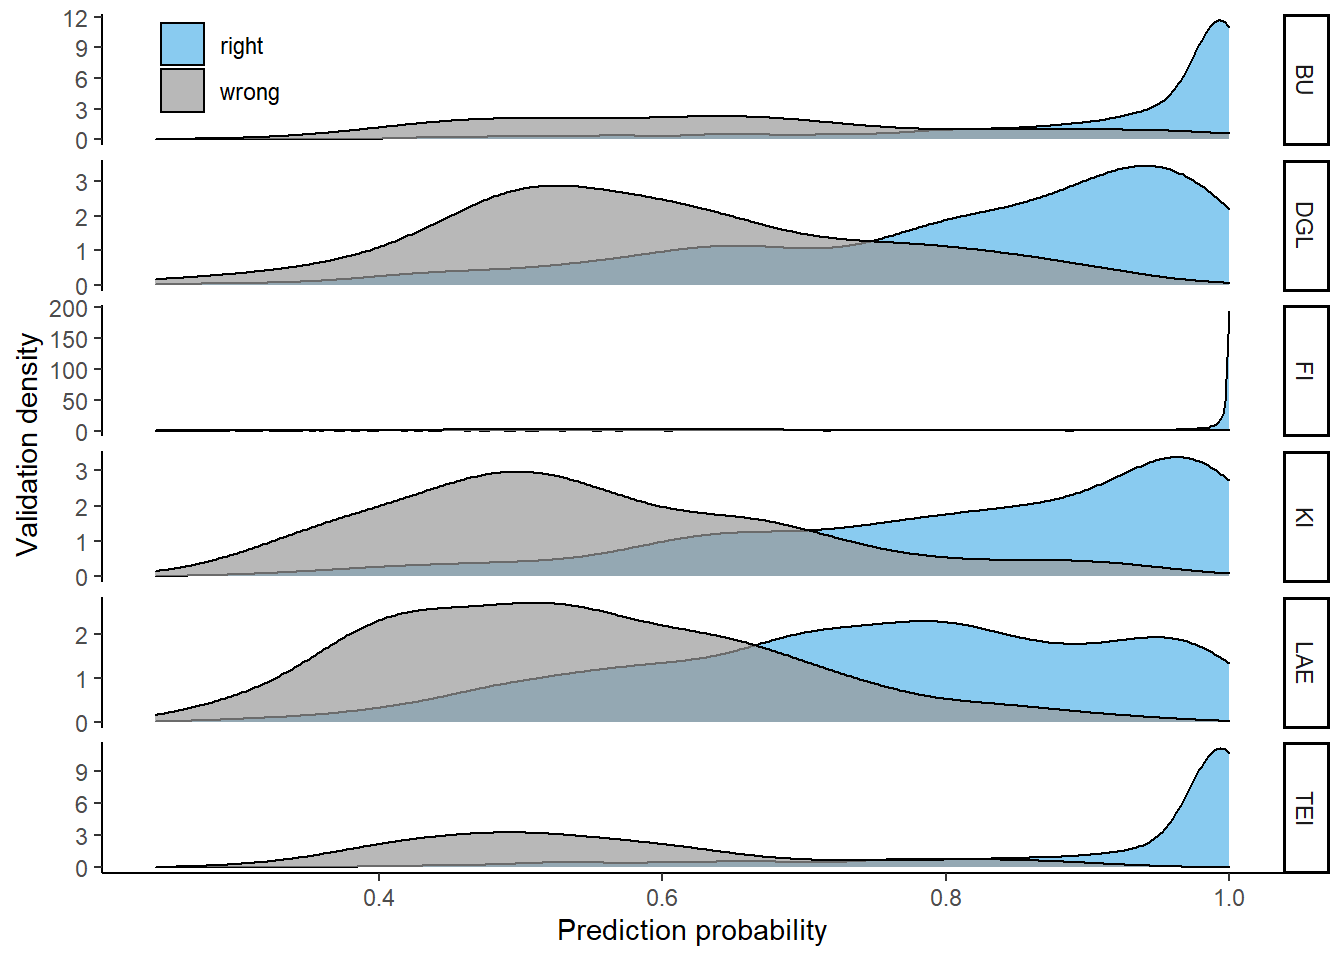
Relative distributions of prediction probabilities by tree species, using the 6-class model
It is obvious that the model is not good at predicting douglas fir, larch and pine. Forest stands of these species are classified correctly with a prediction probability which is on average much lower than these of beech, spruce or oak.
4-class
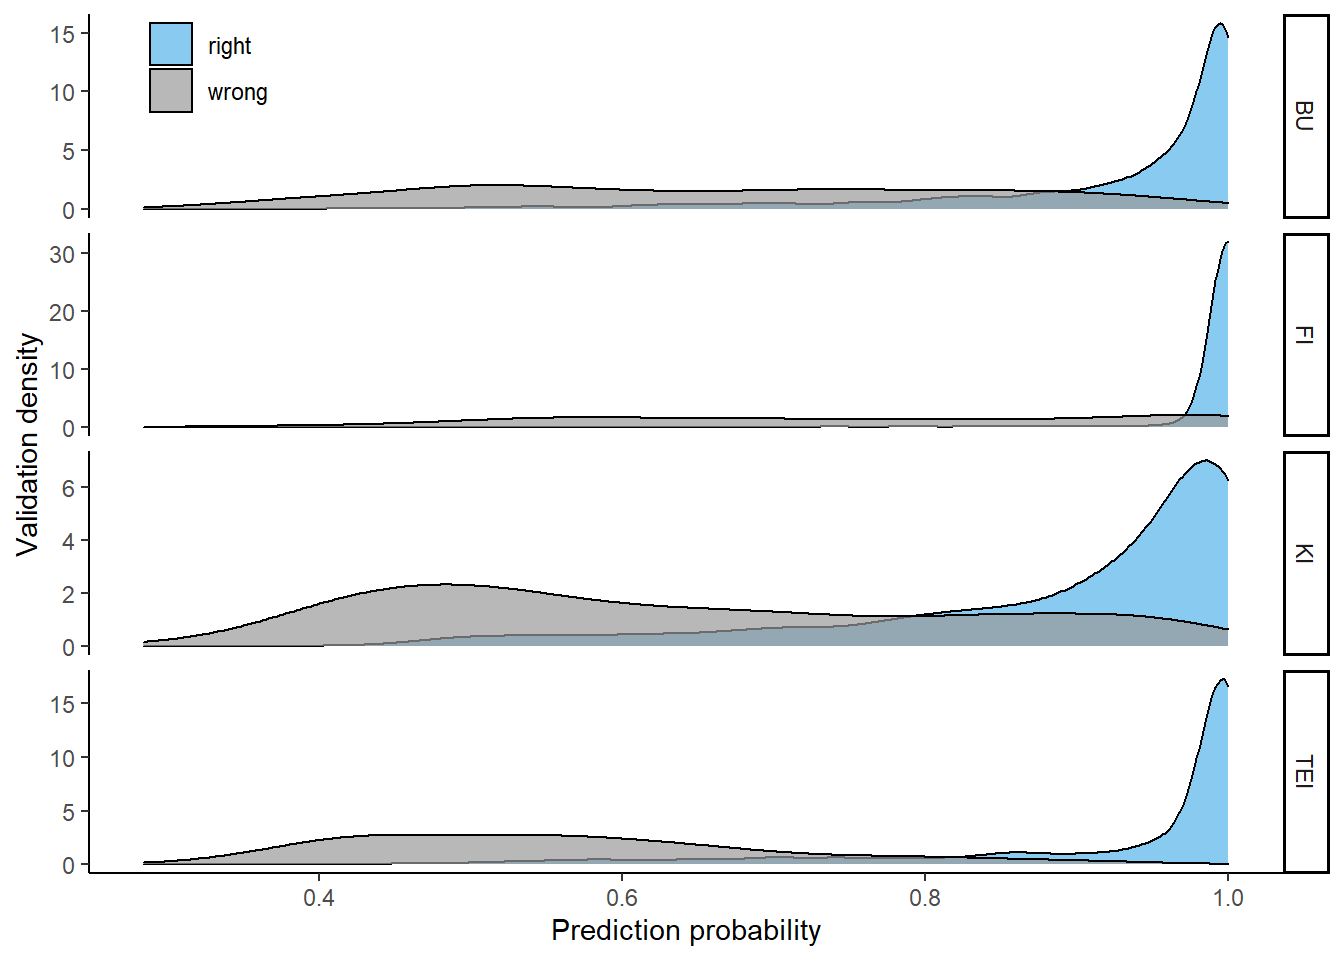
Relative distributions of prediction probabilities by tree species, using the 4-class model
Training the model on just 4 classes results in better performances for all four species. But especially pine stands are predicted with higher probabilities if we exclude douglas fir and larch.
Prediction probabilities of incorrectly classified forest stands increase slightly when using the 4-class model. This is mainly due to the fact that probabilities (always summing up to 1) are distributed among four instead of six classes.
R version 4.0.2 (2020-06-22)
Platform: x86_64-w64-mingw32/x64 (64-bit)
Running under: Windows 10 x64 (build 18362)

Matrix products: default

locale:
[1] LC_COLLATE=German_Germany.1252  LC_CTYPE=German_Germany.1252
[3] LC_MONETARY=German_Germany.1252 LC_NUMERIC=C
[5] LC_TIME=German_Germany.1252

attached base packages:
[1] stats     graphics  grDevices utils     datasets  methods   base

other attached packages:
 [1] rasterVis_0.48      latticeExtra_0.6-29 ranger_0.12.1
 [4] caret_6.0-86        lattice_0.20-41     recipes_0.1.13
 [7] dplyr_1.0.0         here_0.1            plotly_4.9.2.1
[10] ggplot2_3.3.2       readr_1.3.1         rgdal_1.5-12
[13] kableExtra_1.1.0    viridis_0.5.1       viridisLite_0.3.0
[16] raster_3.3-13       sp_1.4-2            workflowr_1.6.2

loaded via a namespace (and not attached):
 [1] nlme_3.1-148         fs_1.4.2             lubridate_1.7.9
 [4] webshot_0.5.2        RColorBrewer_1.1-2   httr_1.4.2
 [7] rprojroot_1.3-2      tools_4.0.2          backports_1.1.7
[10] R6_2.4.1             rpart_4.1-15         lazyeval_0.2.2
[13] colorspace_1.4-1     nnet_7.3-14          withr_2.2.0
[16] tidyselect_1.1.0     gridExtra_2.3        compiler_4.0.2
[19] git2r_0.27.1         rvest_0.3.6          xml2_1.3.2
[22] labeling_0.3         scales_1.1.1         hexbin_1.28.1
[25] randomForest_4.6-14  stringr_1.4.0        digest_0.6.25
[28] rmarkdown_2.3        jpeg_0.1-8.1         pkgconfig_2.0.3
[31] htmltools_0.5.0      highr_0.8            htmlwidgets_1.5.1
[34] rlang_0.4.7          rstudioapi_0.11      farver_2.0.3
[37] generics_0.0.2       zoo_1.8-8            jsonlite_1.7.0
[40] ModelMetrics_1.2.2.2 magrittr_1.5         Matrix_1.2-18
[43] Rcpp_1.0.5           munsell_0.5.0        lifecycle_0.2.0
[46] stringi_1.4.6        whisker_0.4          pROC_1.16.2
[49] yaml_2.2.1           MASS_7.3-51.6        plyr_1.8.6
[52] grid_4.0.2           parallel_4.0.2       promises_1.1.1
[55] crayon_1.3.4         splines_4.0.2        hms_0.5.3
[58] knitr_1.29           pillar_1.4.6         reshape2_1.4.4
[61] codetools_0.2-16     stats4_4.0.2         glue_1.4.1
[64] evaluate_0.14        data.table_1.12.8    vctrs_0.3.2
[67] png_0.1-7            httpuv_1.5.4         foreach_1.5.0
[70] gtable_0.3.0         purrr_0.3.4          tidyr_1.1.0
[73] xfun_0.15            gower_0.2.2          prodlim_2019.11.13
[76] e1071_1.7-3          later_1.1.0.1        class_7.3-17
[79] survival_3.2-3       timeDate_3043.102    tibble_3.0.3
[82] iterators_1.0.12     lava_1.6.7           ellipsis_0.3.1
[85] ipred_0.9-9