Last updated: 2020-09-16
Checks: 7 0
Knit directory: baumarten/analysis/
This reproducible R Markdown analysis was created with workflowr (version 1.6.2). The Checks tab describes the reproducibility checks that were applied when the results were created. The Past versions tab lists the development history.
Great! Since the R Markdown file has been committed to the Git repository, you know the exact version of the code that produced these results.
Great job! The global environment was empty. Objects defined in the global environment can affect the analysis in your R Markdown file in unknown ways. For reproduciblity it’s best to always run the code in an empty environment.
The command set.seed(20200723) was run prior to running the code in the R Markdown file. Setting a seed ensures that any results that rely on randomness, e.g. subsampling or permutations, are reproducible.
Great job! Recording the operating system, R version, and package versions is critical for reproducibility.
Nice! There were no cached chunks for this analysis, so you can be confident that you successfully produced the results during this run.
Great job! Using relative paths to the files within your workflowr project makes it easier to run your code on other machines.
Great! You are using Git for version control. Tracking code development and connecting the code version to the results is critical for reproducibility.
The results in this page were generated with repository version 1bb6171. See the Past versions tab to see a history of the changes made to the R Markdown and HTML files.
Note that you need to be careful to ensure that all relevant files for the analysis have been committed to Git prior to generating the results (you can use wflow_publish or wflow_git_commit). workflowr only checks the R Markdown file, but you know if there are other scripts or data files that it depends on. Below is the status of the Git repository when the results were generated:
Ignored files:
    Ignored:    .Rhistory
    Ignored:    .Rproj.user/
    Ignored:    analysis/.Rhistory
    Ignored:    data/sen2/

Untracked files:
    Untracked:  baumarten_viz.qgz

Unstaged changes:
    Deleted:    analysis/evaluation.Rmd
    Deleted:    analysis/probability.Rmd
    Modified:   code/workflow_project_setup.R
Note that any generated files, e.g. HTML, png, CSS, etc., are not included in this status report because it is ok for generated content to have uncommitted changes.
These are the previous versions of the repository in which changes were made to the R Markdown (analysis/probability_threshold.Rmd) and HTML (docs/probability_threshold.html) files. If you’ve configured a remote Git repository (see ?wflow_git_remote), click on the hyperlinks in the table below to view the files as they were in that past version.
| File | Version | Author | Date | Message |
|---|---|---|---|---|
| Rmd | 1bb6171 | wiesehahn | 2020-09-16 | Publish all files for myproject |
Probability filtering
Background
To predict the tree species for a pixel our random forest model calculates relative probabilities for that pixel to belong to each class. These probabilities sum up to 1. The tree species is predicted by choosing the class with highest probability. In areas where the model is quite sure probabilities will be high for one species and low for the others. In areas where the model is not fitted perfectly probabilities will be similar between species. The idea is to mask pixel predictions with low certainties and fill them with predictions of surrounding pixels in a later step.
Probability distributions
Most data which was classified correctly had high probability values, while incorrectly classified validation data has a much wider distribution but was mostly classified with probabilities around 0.5. Using a 4-class model without larch and douglas fir especially increased the probabilities of correctly classified validation pixels.
6-class
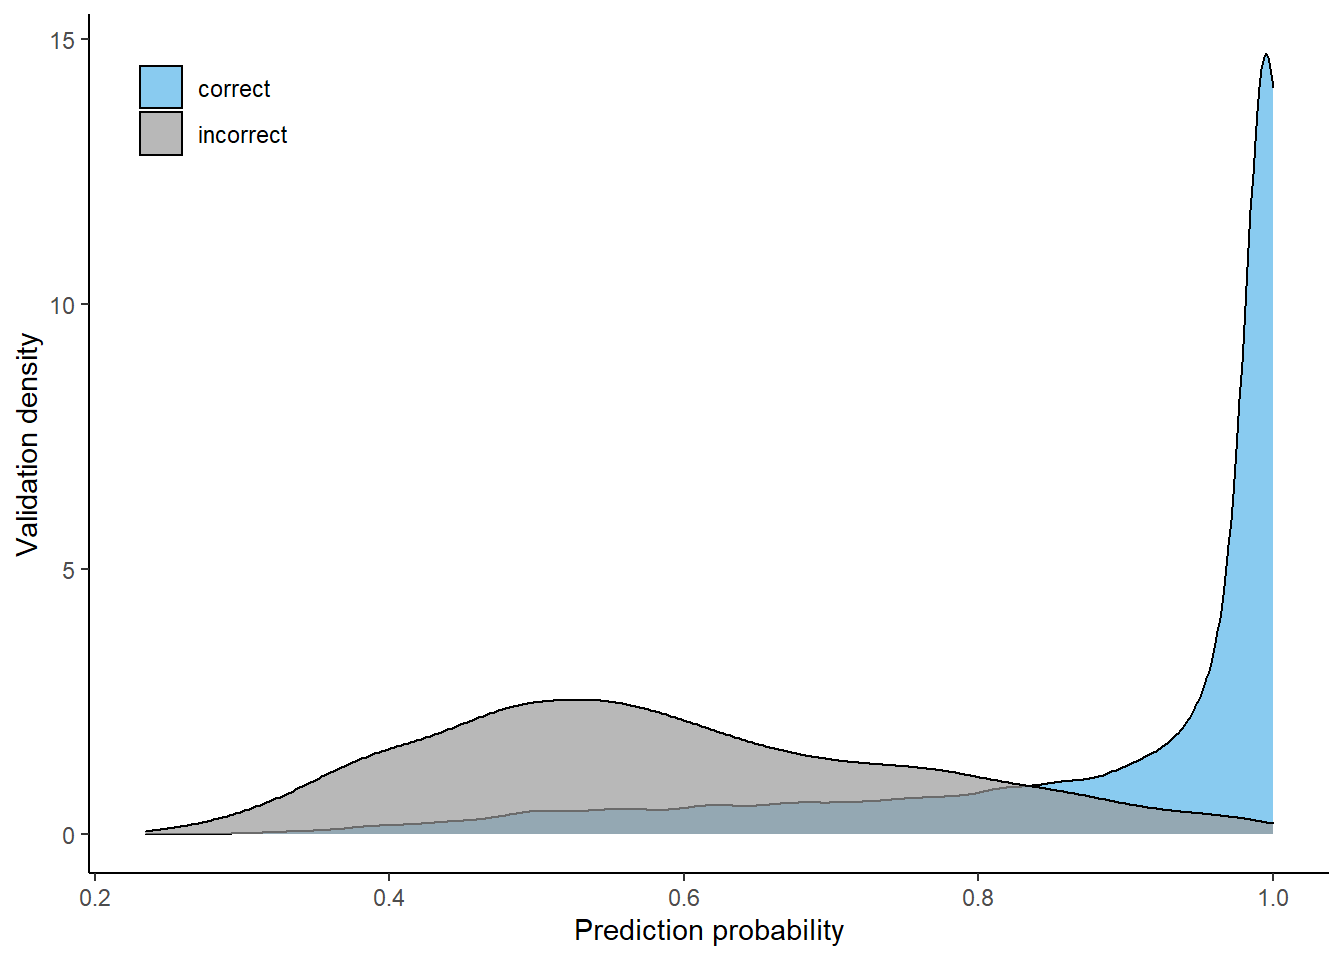
Prediction probability distributions (correct cs. incorrect), using 6-class model
4-class
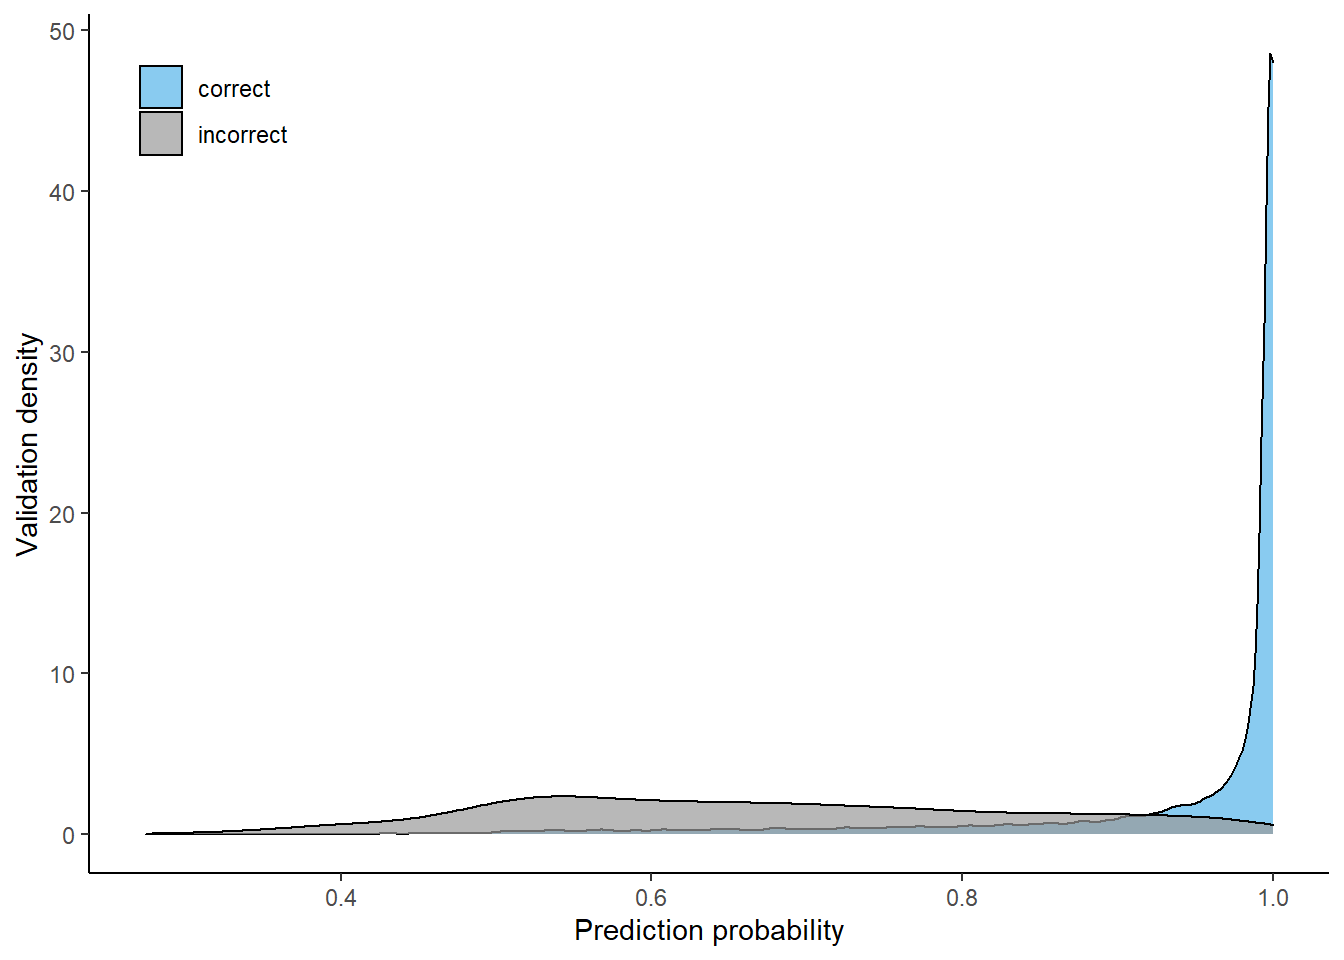
Prediction probability distributions (correct cs. incorrect), using 4-class model
Question
Up until which classification probability is the chance of misclassification higher than the chance of correct classification?
Results
By model
Up until a probability value of 0.58 in the 6-class model, the chance of a pixel being misclassified is higher than the chance for correct classification. With higher probabilities we see a steep rise in correct classifications while incorrect classifications occur to a smaller fraction.
6-class
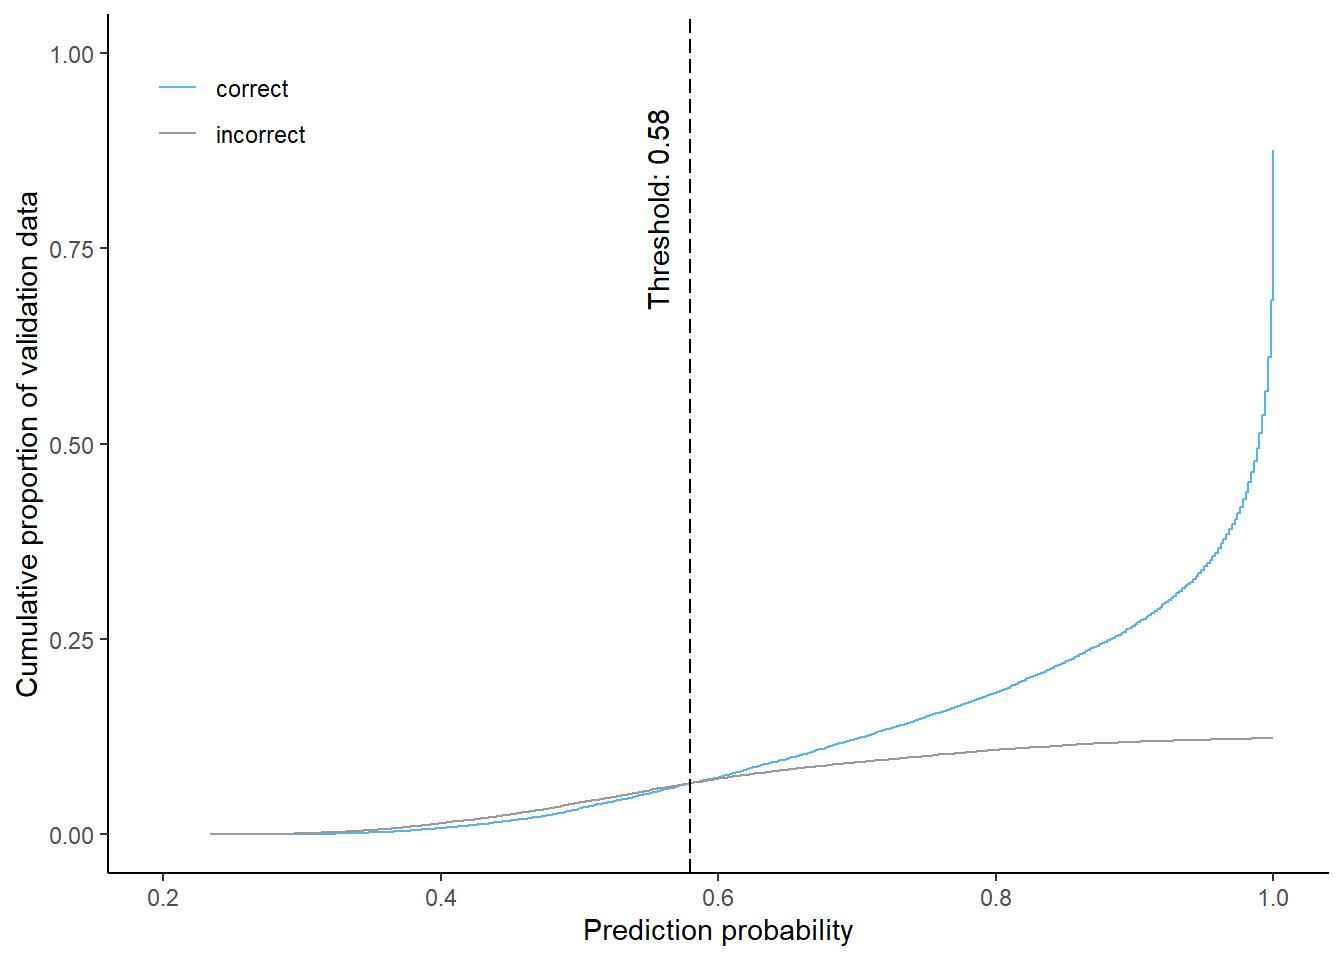
Cumulative proportion of correctly and incorrectly predicted validation data by prediction probability and corresponding threshold for equal shares (using 6-class model)
Using a probability threshold of 0.58 approximately 13.1% of the predictions are masked when using the 6-class model. About 6.6% of each correctly and incorrectly classified pixels will be masked.
4-class
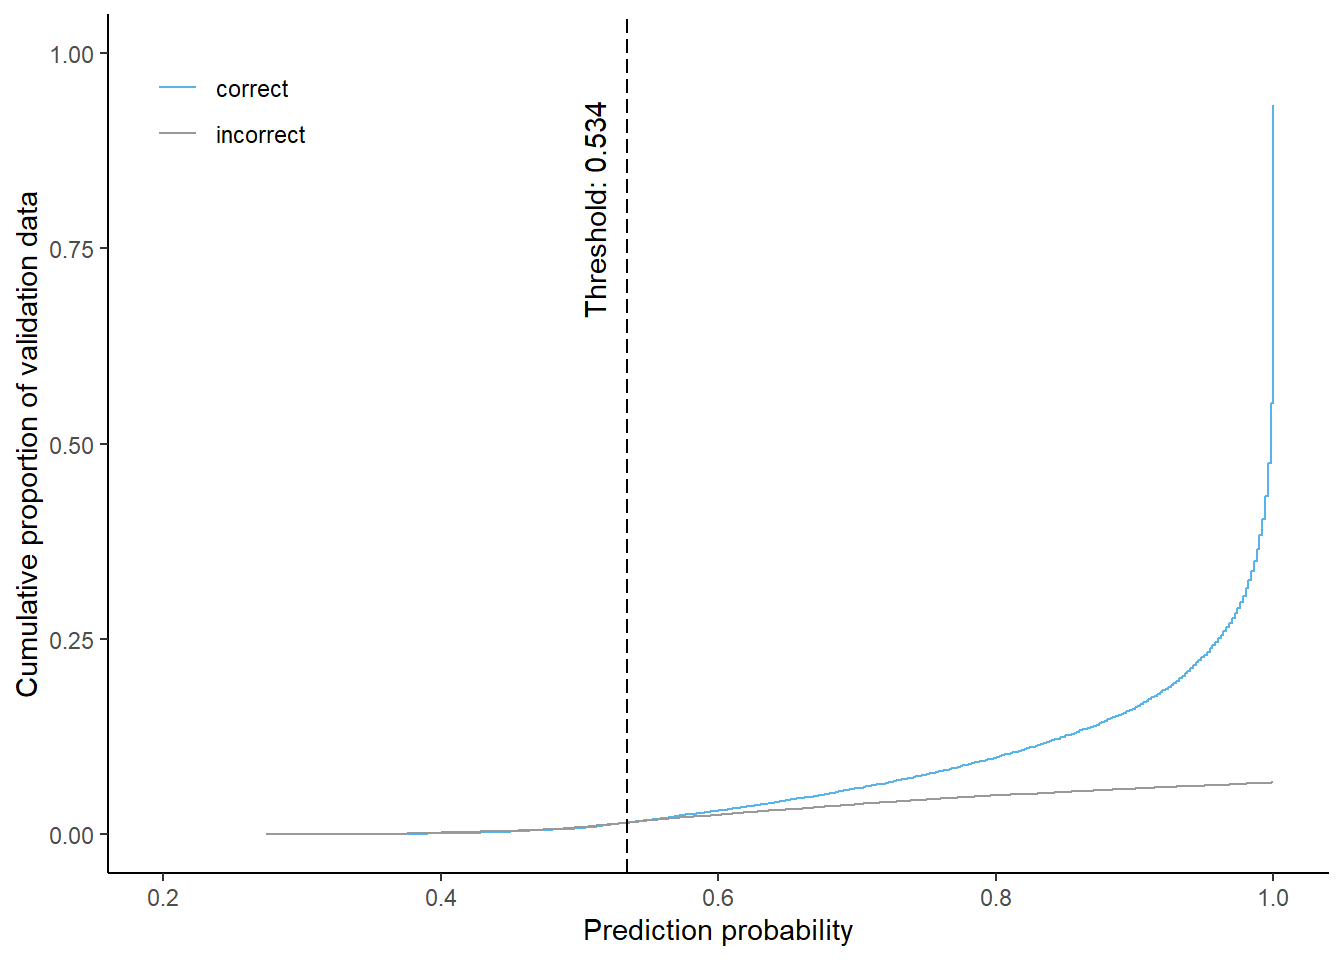
Cumulative proportion of correctly and incorrectly predicted validation data by prediction probability and corresponding threshold for equal shares (using 4-class model)
Using a probability threshold of 0.534 approximately 3% of the predictions are masked when using the 4-class model. About 1.5% of each correctly and incorrectly classified pixels will be masked.
By region
Harz
Probability
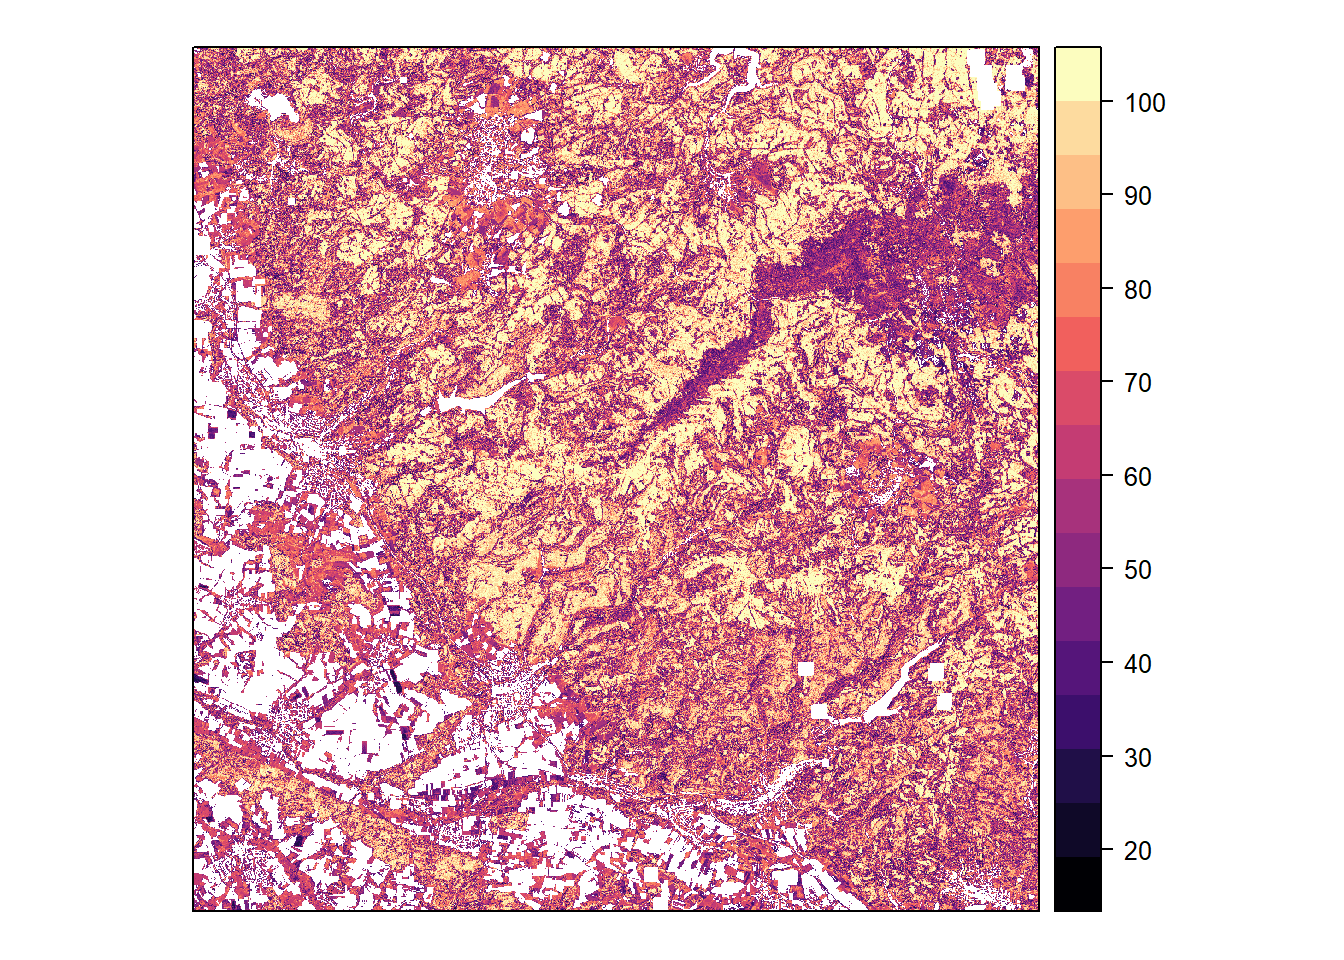
Classification probability (maximum among species) calculated by the model
Classification
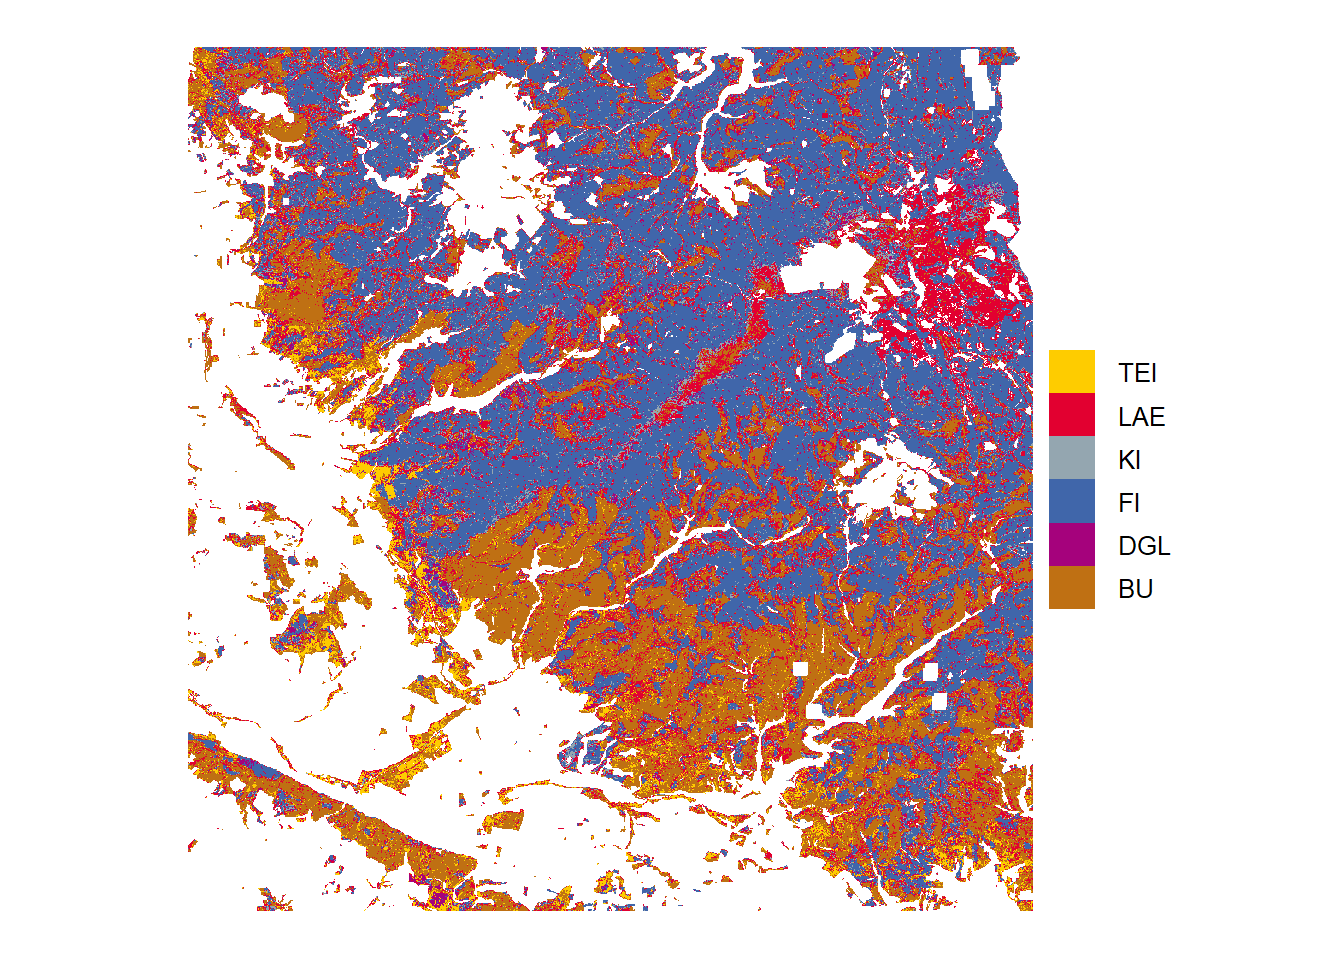
Tree species predictions from highest probabilities in the study area Harz
High probability
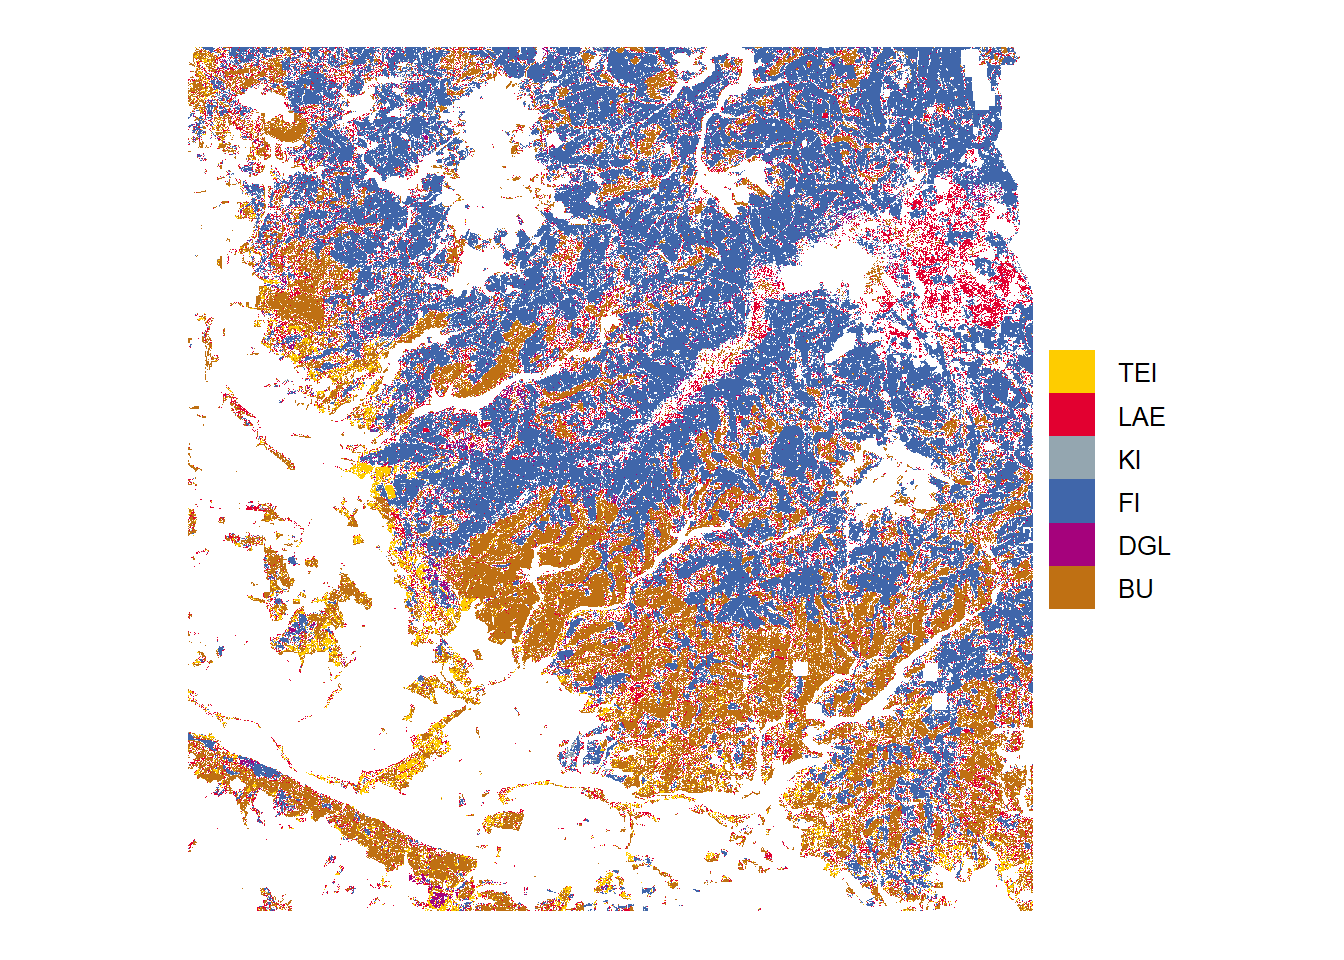
Tree species predictions with high probabilities (above threshold)
Low probability

Tree species predictions with low probabilities (below threshold)
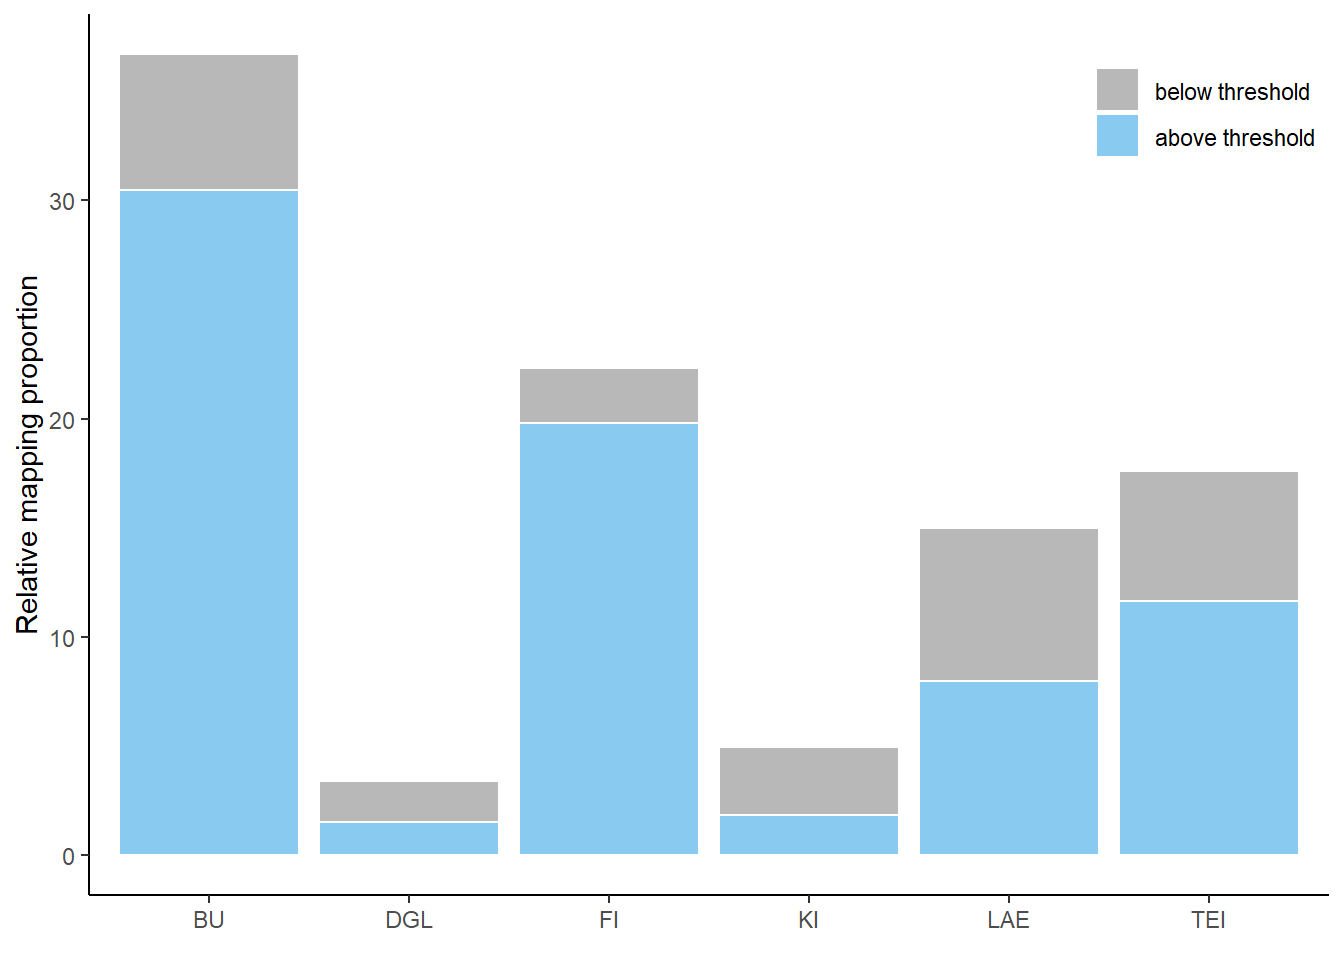
Histogram
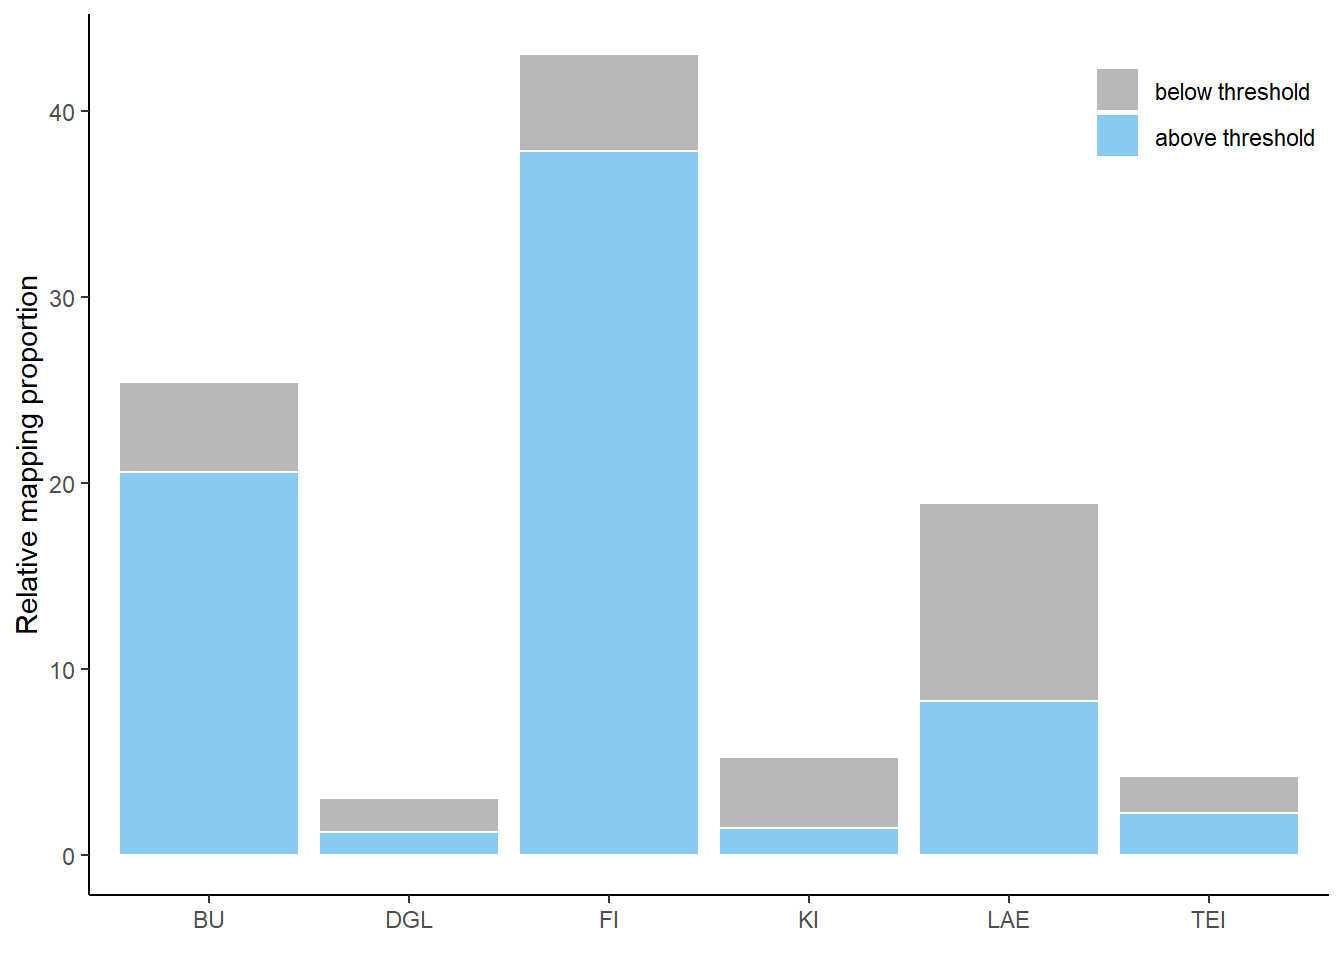
Histogram of predictions in the study area Harz, differentiated between low and high probabilities
Solling
Probability
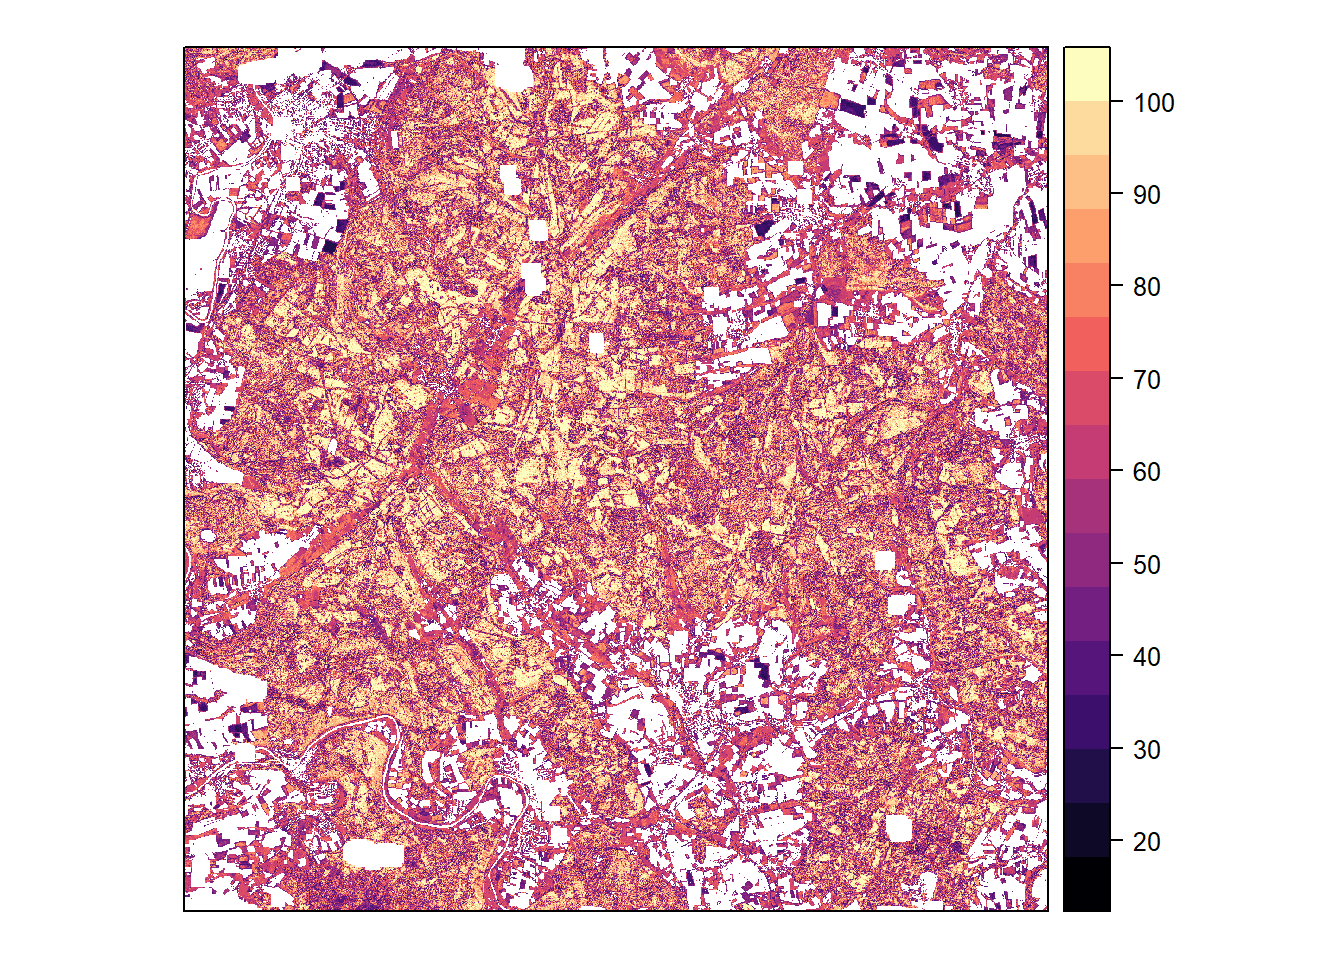
Classification probability (maximum among species) calculated by the model
Classification
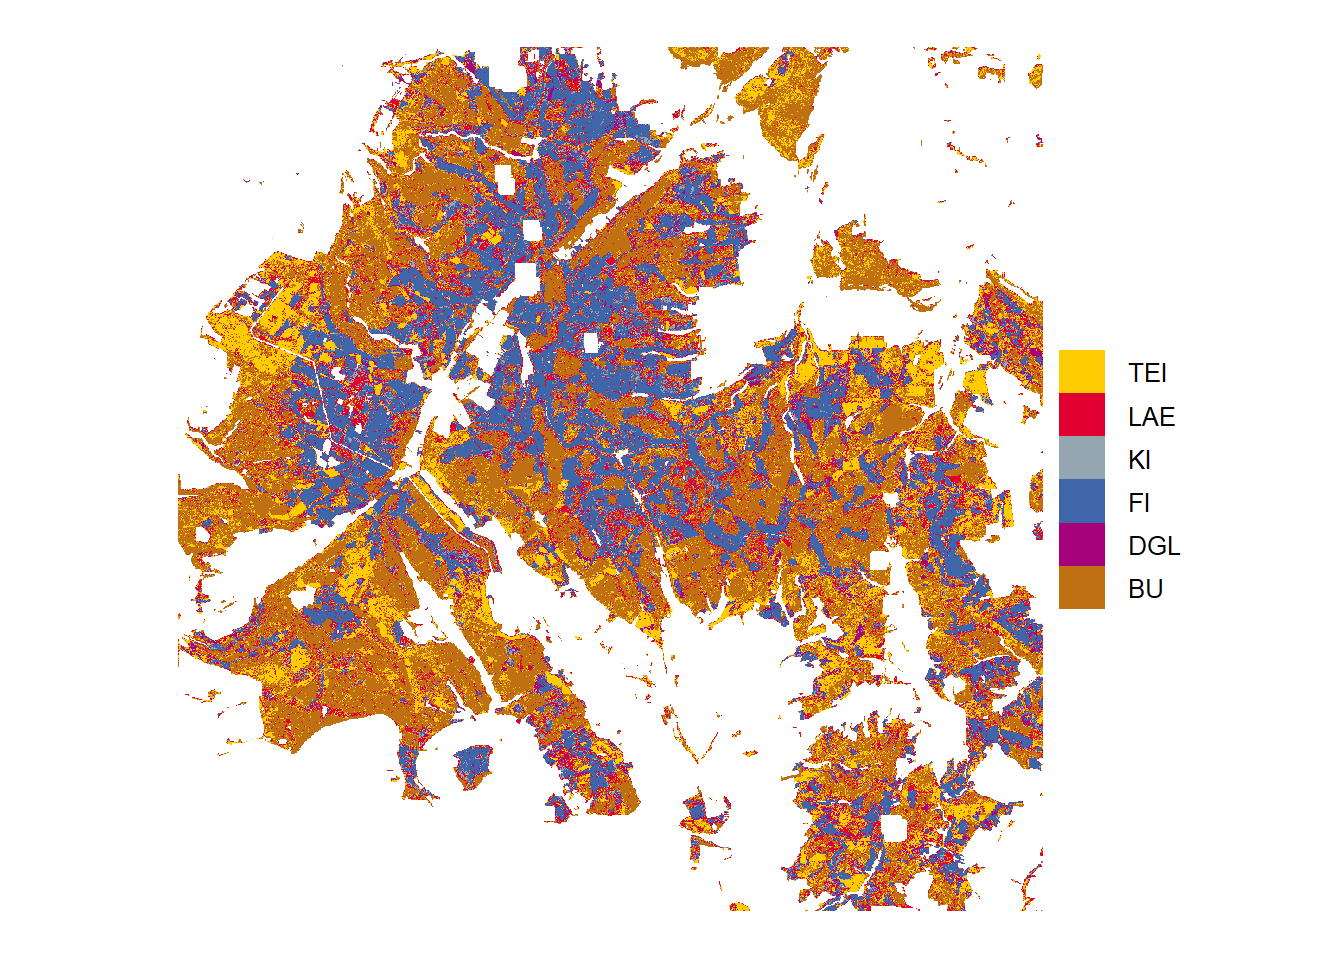
Tree species predictions from highest probabilities in the study area Solling
High probability
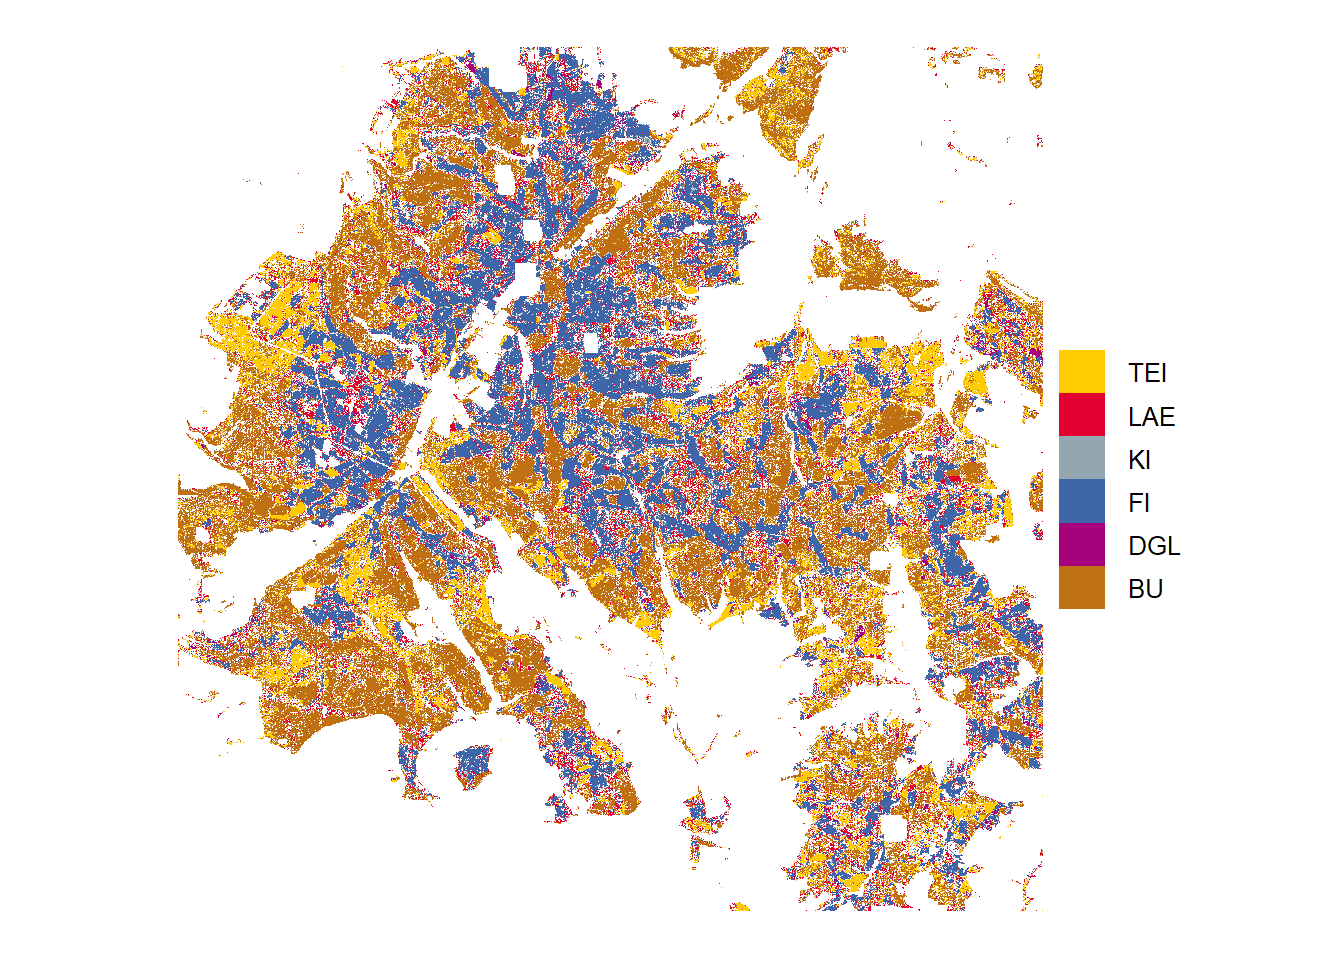
Tree species predictions with high probabilities (above threshold)
Low probability
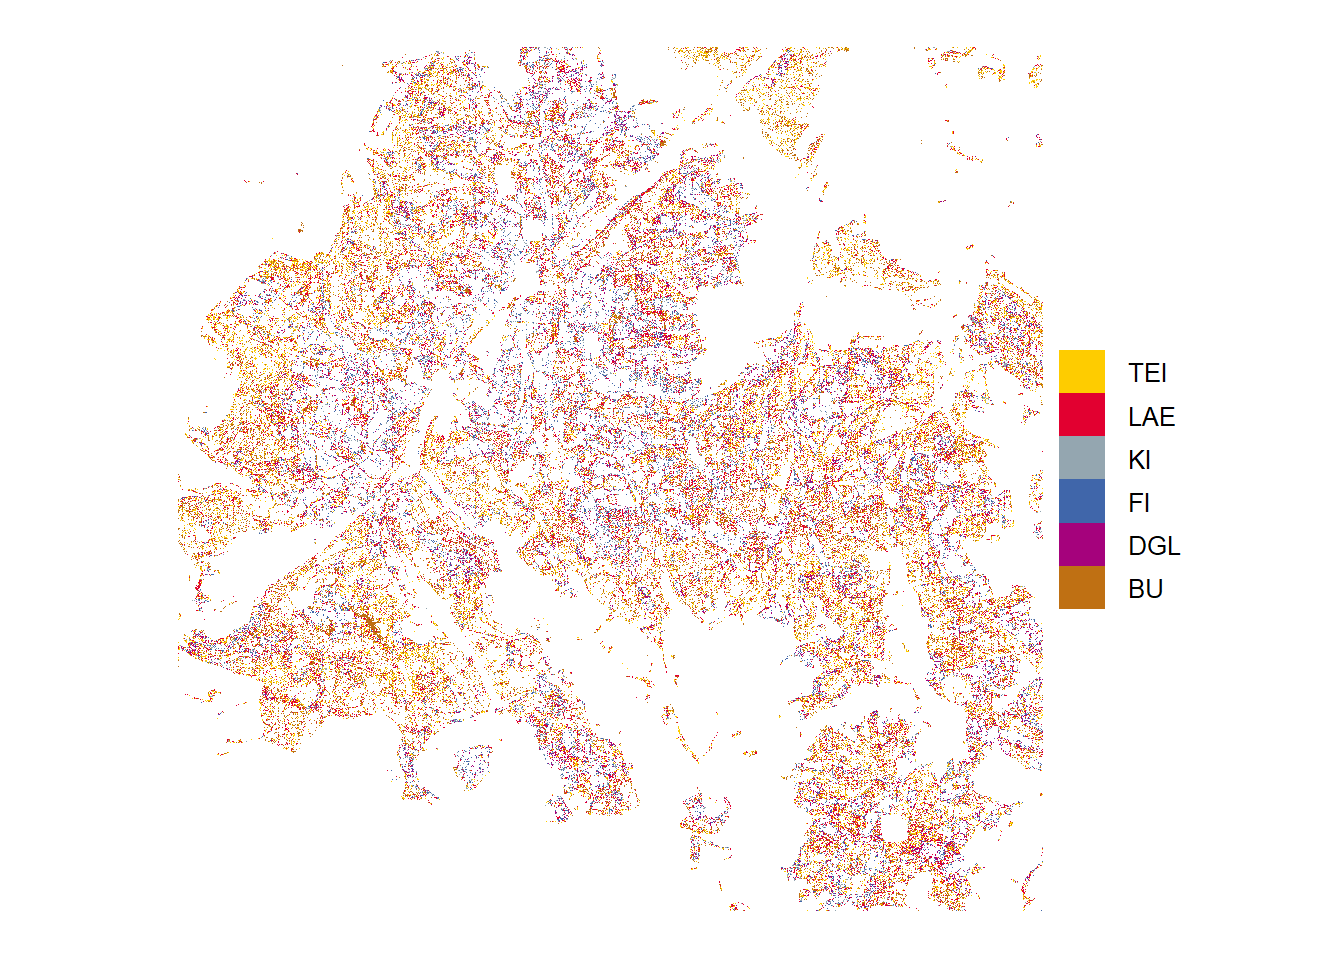
Tree species predictions with low probabilities (below threshold)
Histogram
Histogram of predictions in the study area Solling, differentiated between low and high probabilities
Heide
Probability
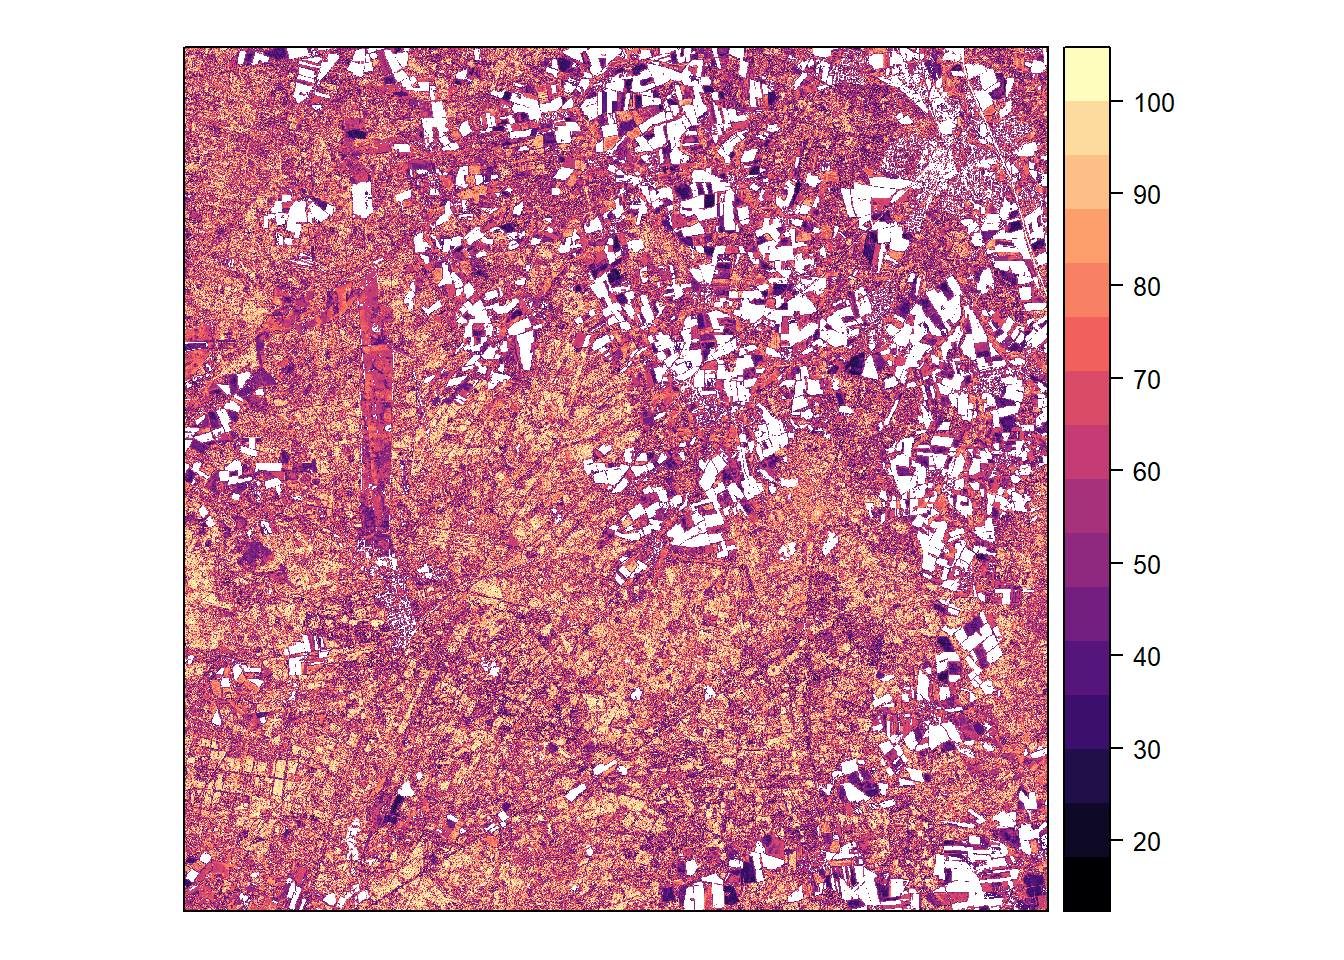
Classification probability (maximum among species) calculated by the model
Classification
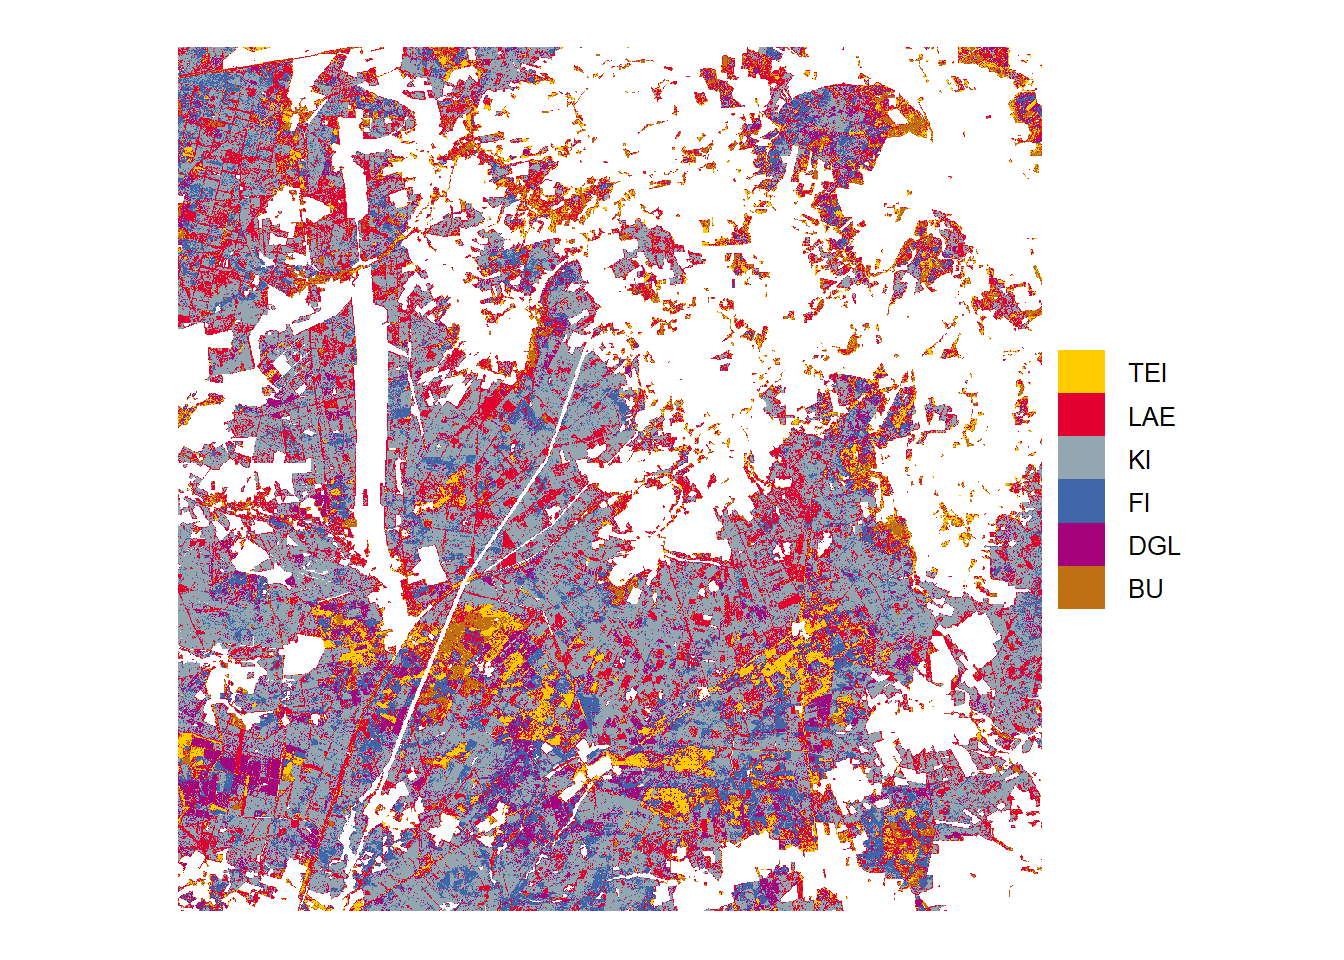
Tree species predictions from highest probabilities in the study area Heide
High probability
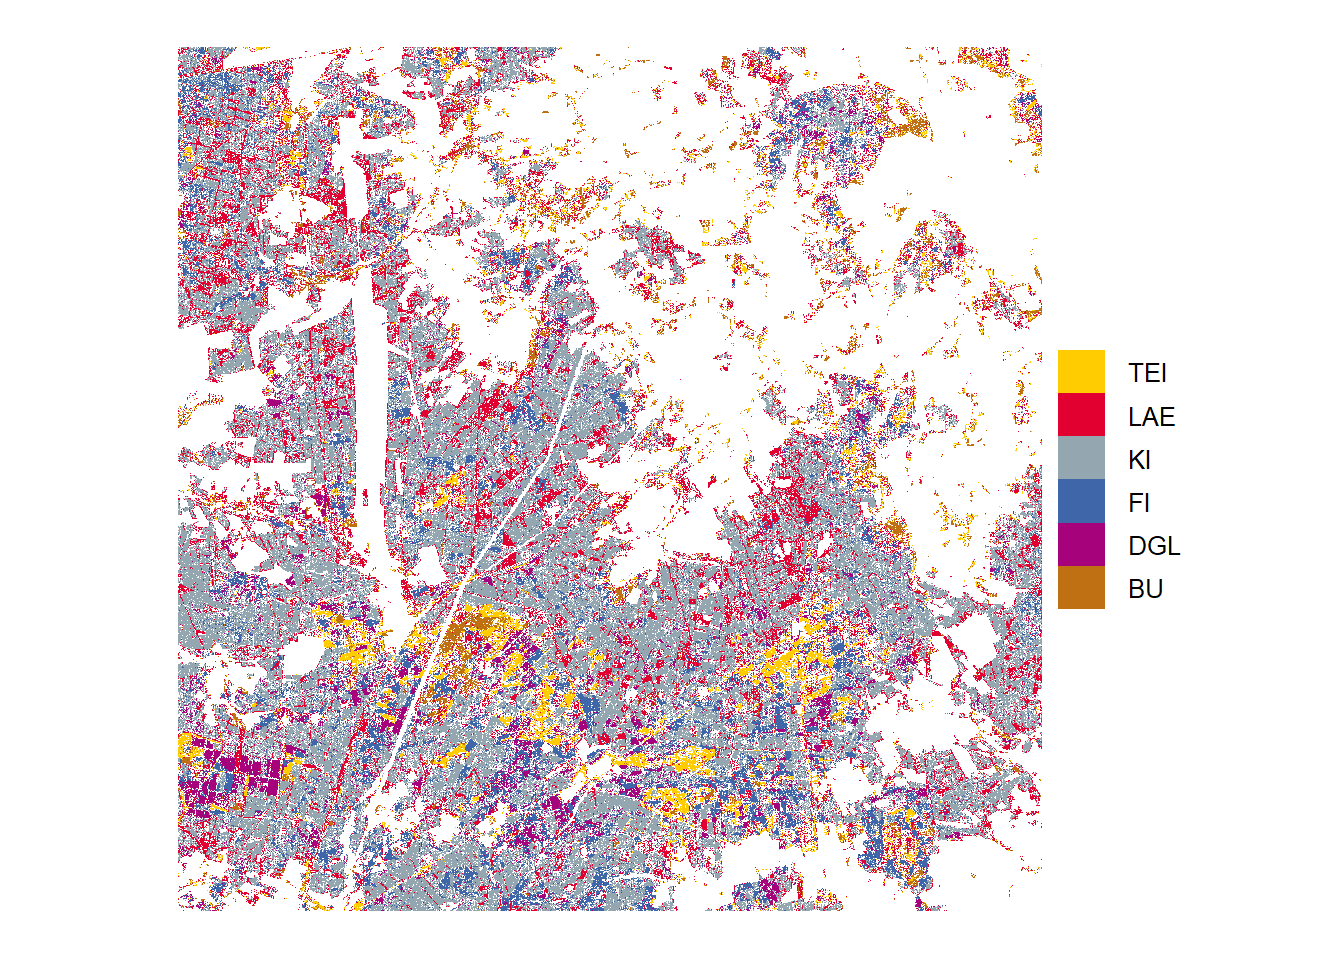
Tree species predictions with high probabilities (above threshold)
Low probability
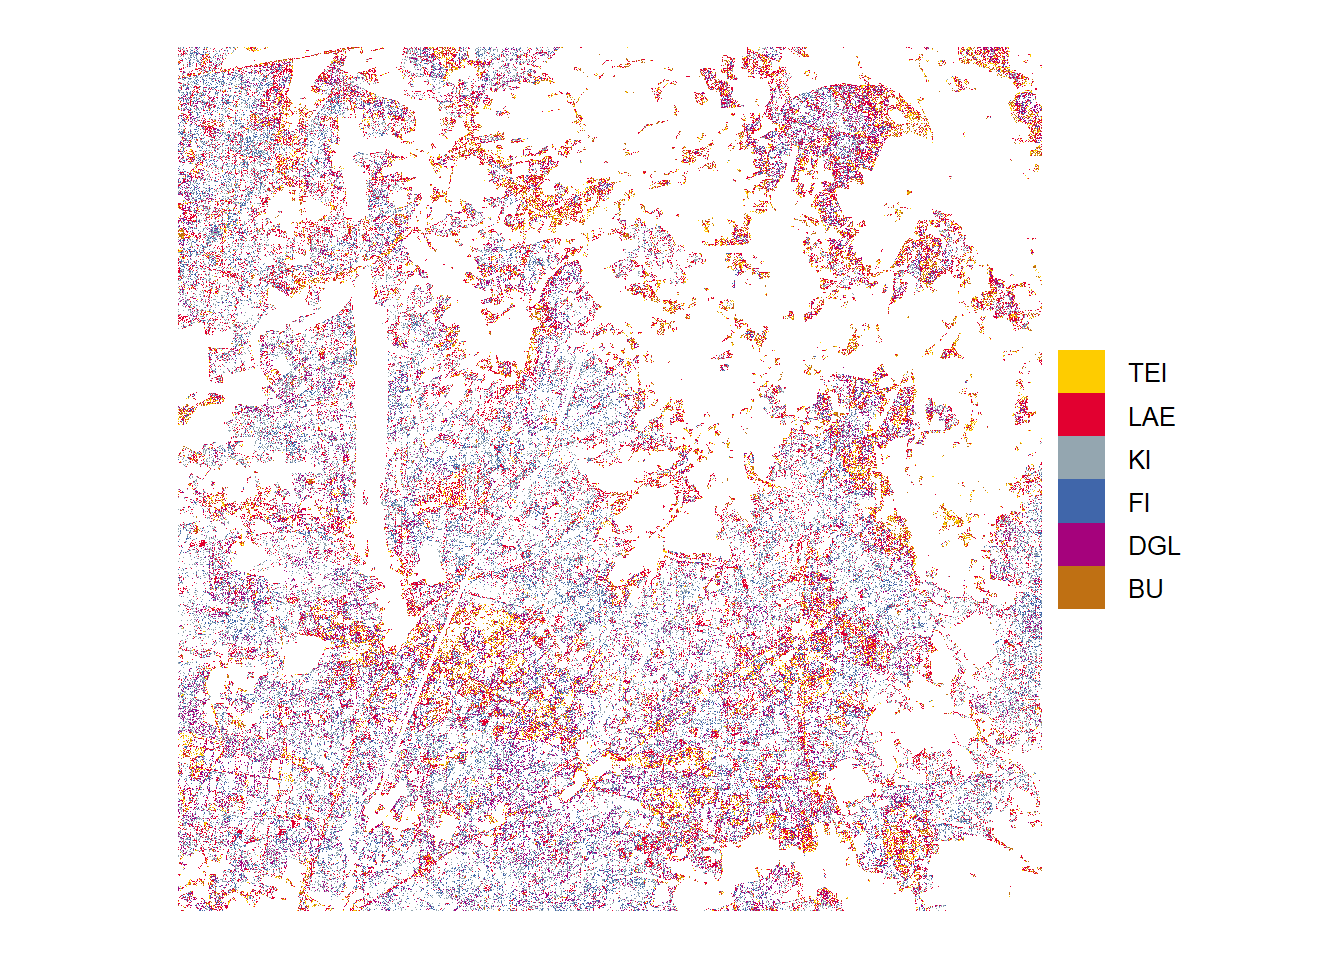
Tree species predictions with low probabilities (below threshold)
Histogram
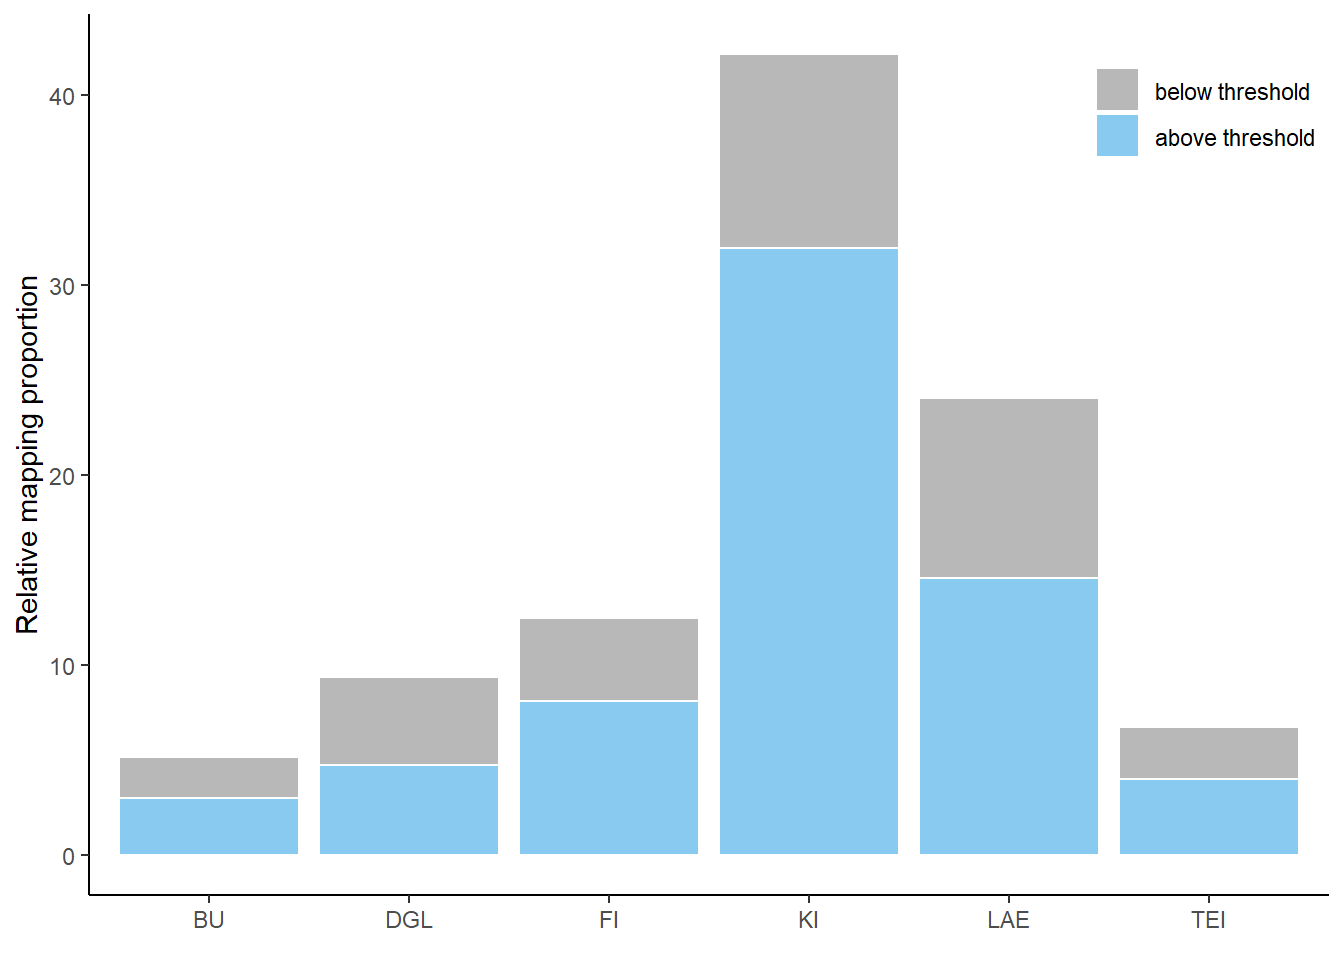
Histogram of predictions in the study area Heide, differentiated between low and high probabilities
By species
Beech
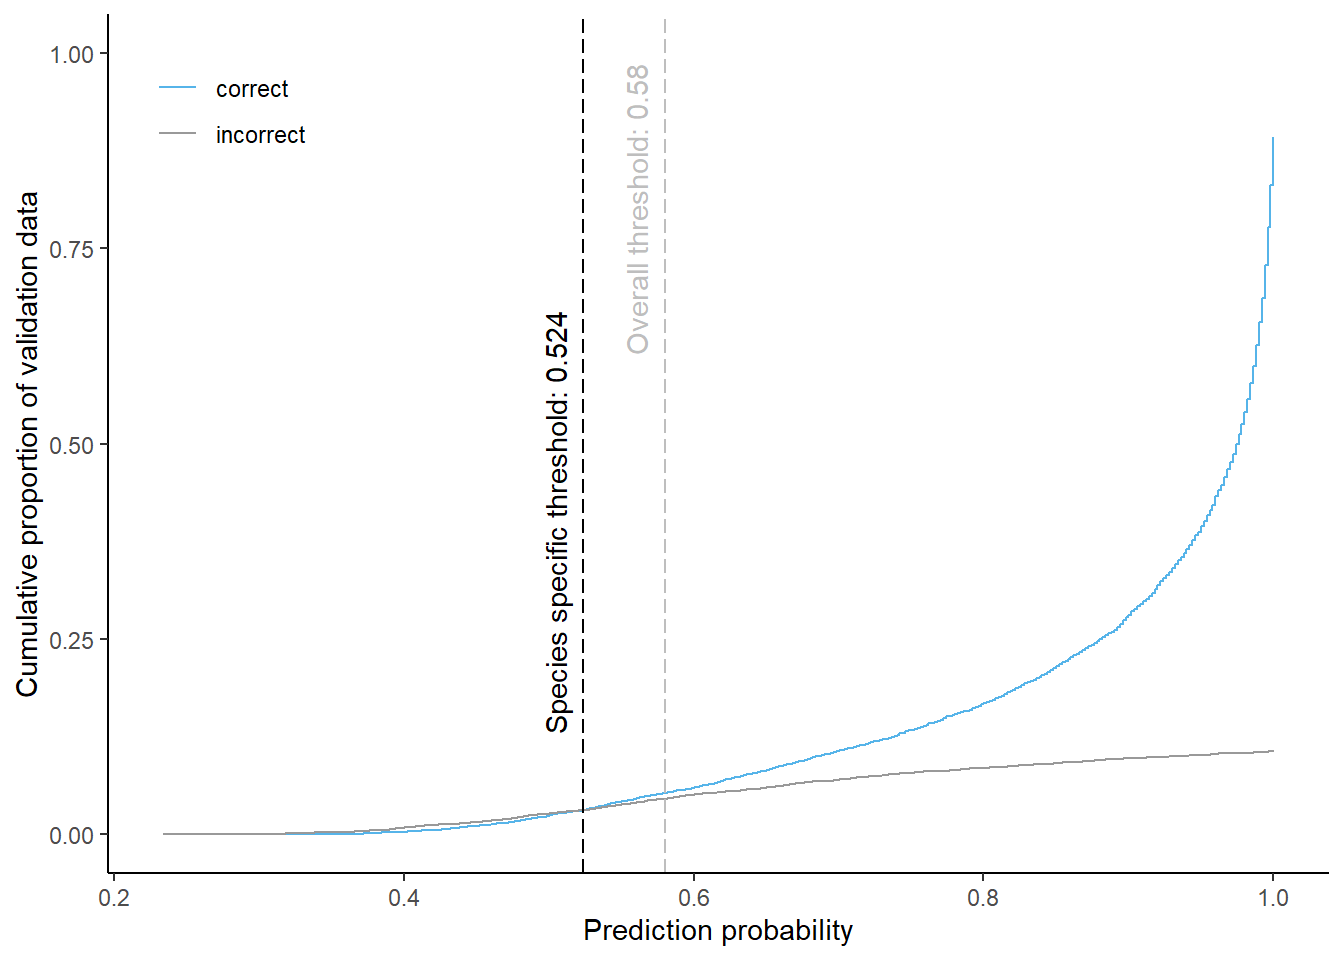
Cumulative proportion of validation data predicted correctly or incorrectly as beech (by prediction probability)
The species specific probability threshold for beech (below which more predictions are classified incorrectly and than correctly) is 0.524. Approximately 6.3% of the predictions classified as beech would be masked if we apply this threshold. About 3.1% of pixels classified correctly and 3.1% of pixels classified incorrectly as beech be masked.
Douglas fir
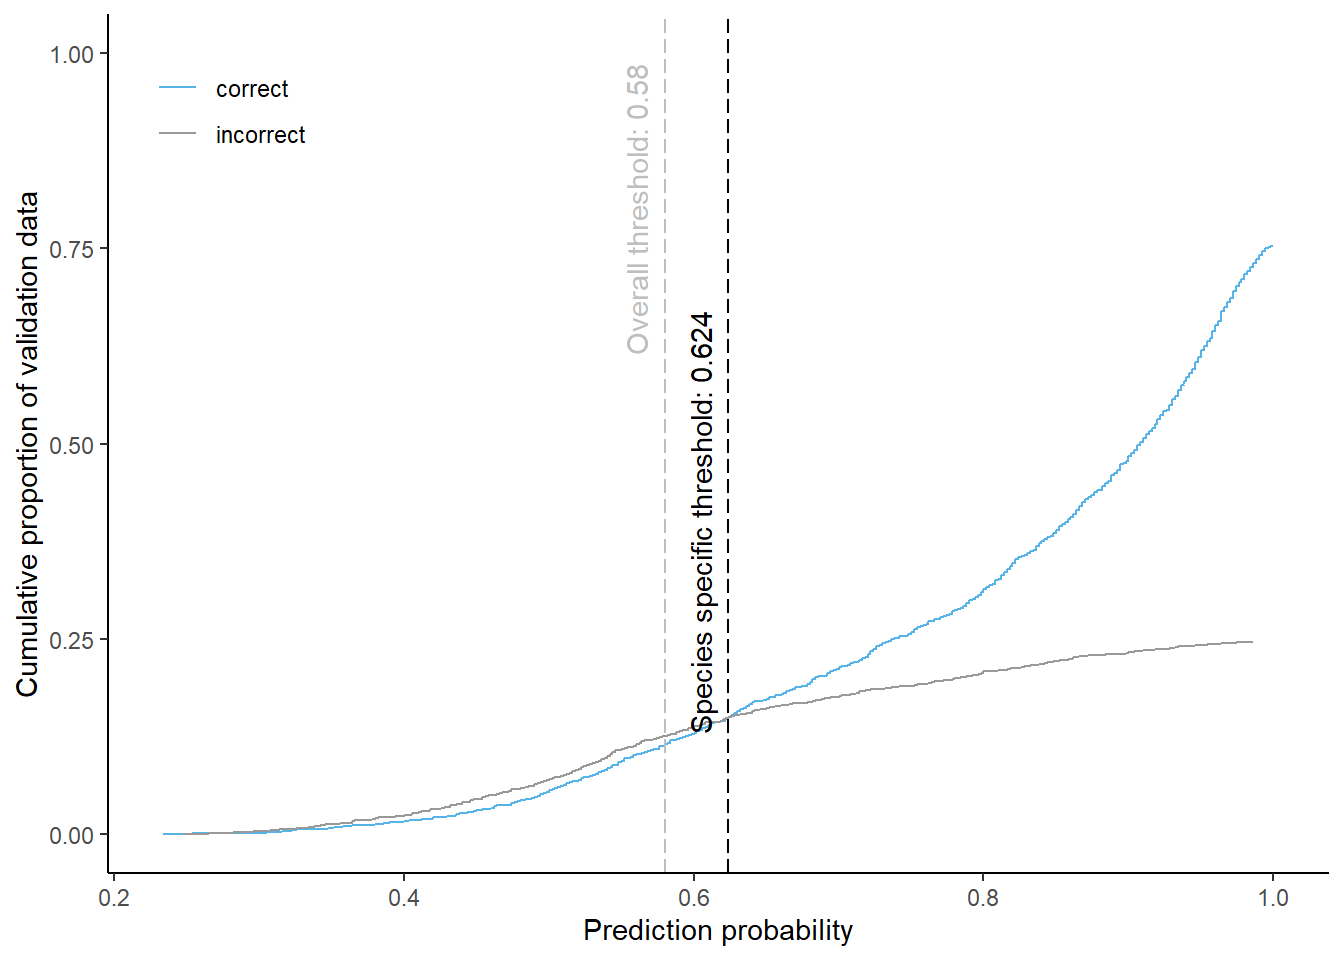
Cumulative proportion of validation data predicted correctly or incorrectly as douglas fir (by prediction probability)
The species specific probability threshold for douglas fir (below which more predictions are classified incorrectly and than correctly) is 0.624. Approximately % of the predictions classified as douglas fir would be masked if we apply this threshold. About % of pixels classified correctly and % of pixels classified incorrectly as douglas fir be masked.
Spruce
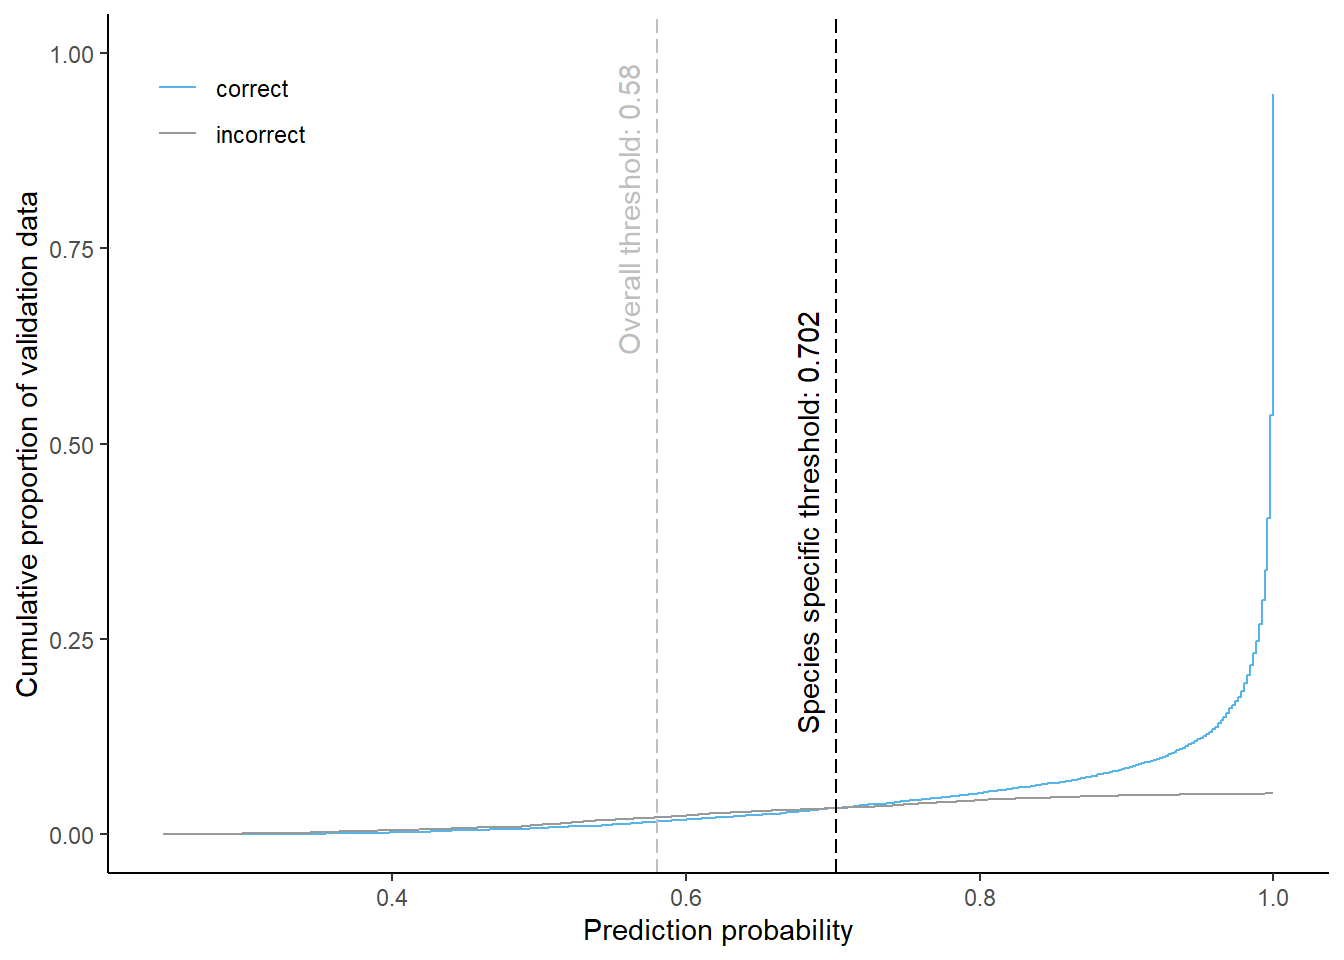
Cumulative proportion of validation data predicted correctly or incorrectly as spruce (by prediction probability)
The species specific probability threshold for spruce (below which more predictions are classified incorrectly and than correctly) is 0.702. Approximately % of the predictions classified as spruce would be masked if we apply this threshold. About % of pixels classified correctly and % of pixels classified incorrectly as spruce be masked.
Pine
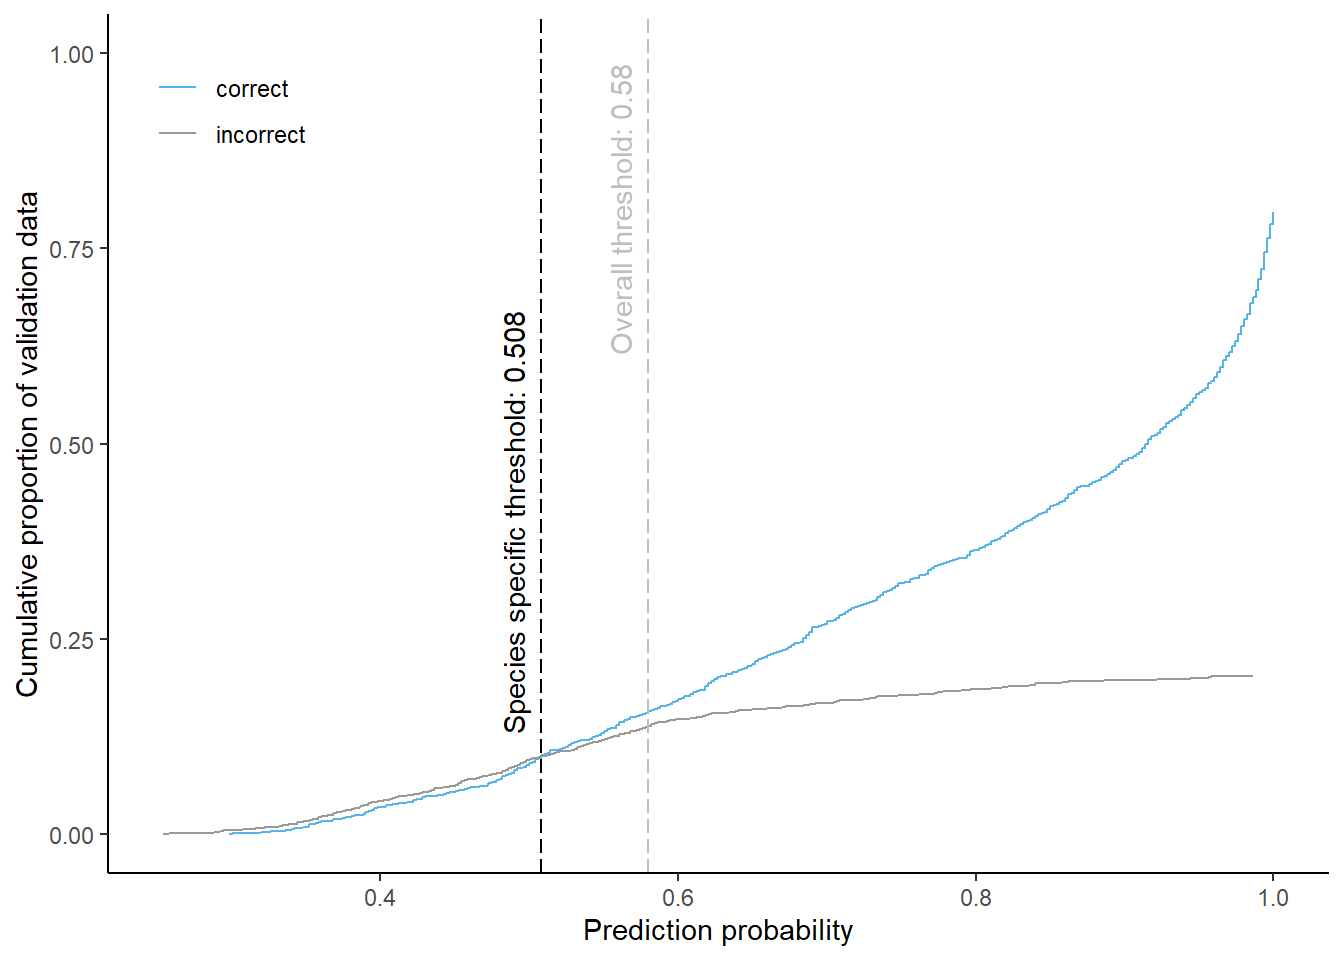
Cumulative proportion of validation data predicted correctly or incorrectly as pine (by prediction probability)
The species specific probability threshold for pine (below which more predictions are classified incorrectly and than correctly) is 0.508. Approximately % of the predictions classified as pine would be masked if we apply this threshold. About % of pixels classified correctly and % of pixels classified incorrectly as pine be masked.
Larch
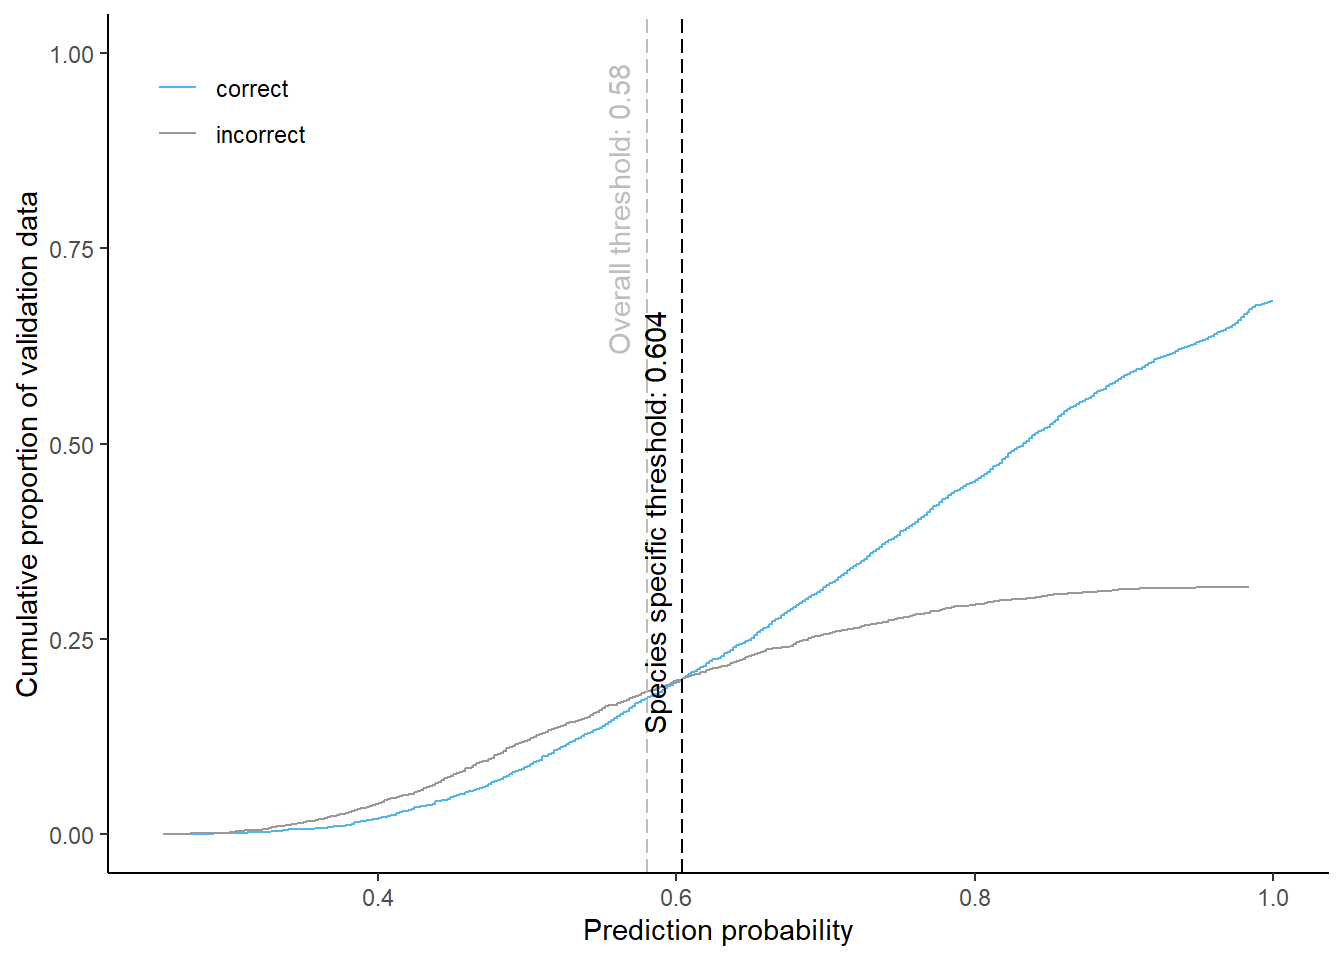
Cumulative proportion of validation data predicted correctly or incorrectly as larch (by prediction probability)
The species specific probability threshold for larch (below which more predictions are classified incorrectly and than correctly) is 0.604. Approximately % of the predictions classified as larch would be masked if we apply this threshold. About % of pixels classified correctly and % of pixels classified incorrectly as larch be masked.
Oak
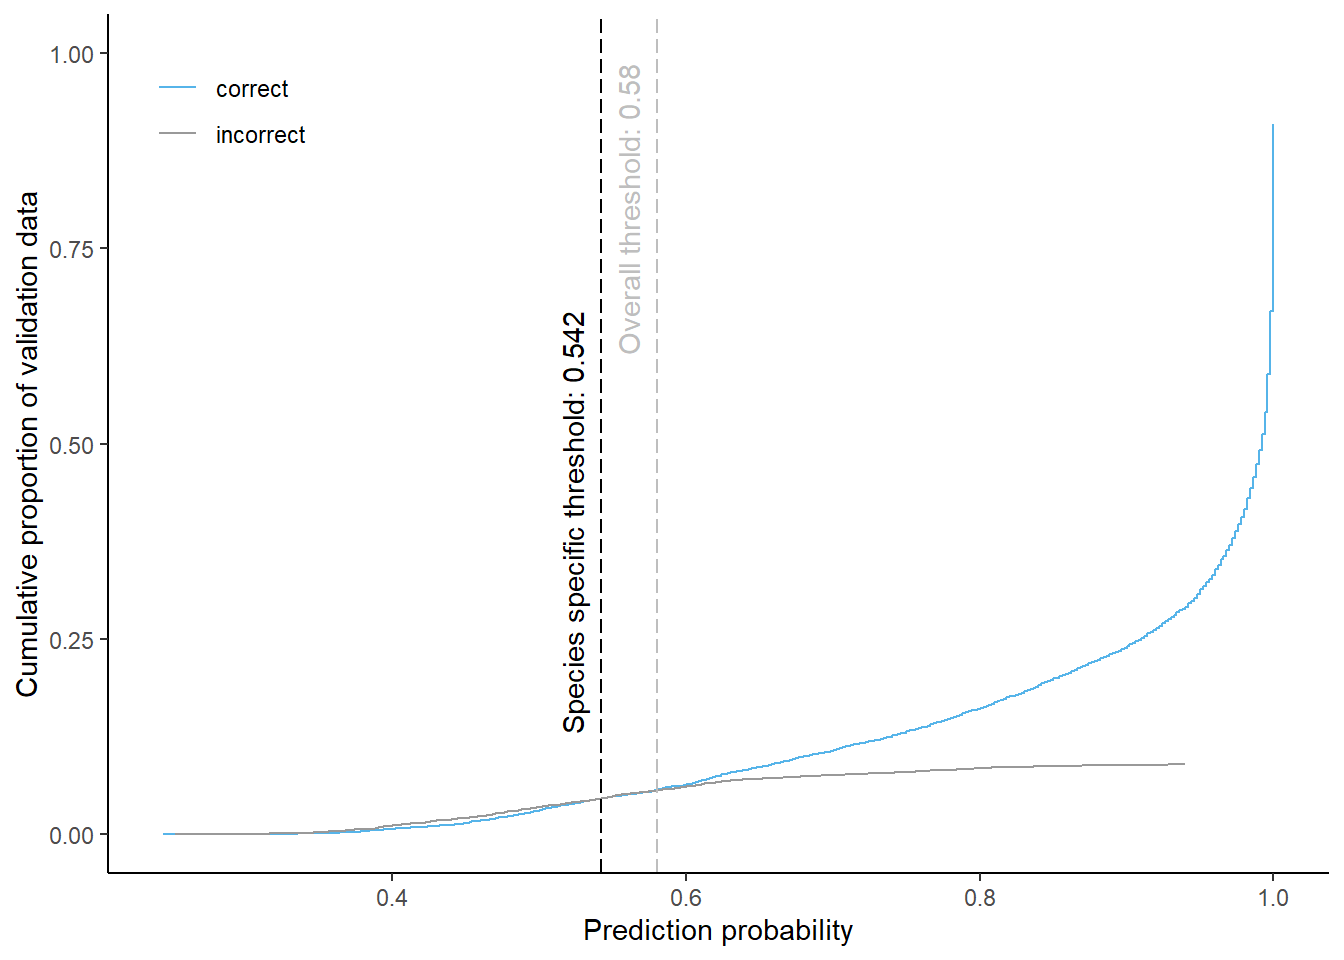
Cumulative proportion of validation data predicted correctly or incorrectly as oak (by prediction probability)
The species specific probability threshold for oak (below which more predictions are classified incorrectly and than correctly) is 0.542. Approximately % of the predictions classified as oak would be masked if we apply this threshold. About % of pixels classified correctly and % of pixels classified incorrectly as oak be masked.
As we can see the probability threshold below which predictions are more likely to be misclassified than correctly classified also varies by species. However, the exact distribution of prediction probabilities and their classification result varies between random forest models which are created by stratified but randomized folding in our case. For a different random seed the species specific threshold might change to a certain degree.
R version 4.0.2 (2020-06-22)
Platform: x86_64-w64-mingw32/x64 (64-bit)
Running under: Windows 10 x64 (build 18362)

Matrix products: default

locale:
[1] LC_COLLATE=German_Germany.1252  LC_CTYPE=German_Germany.1252
[3] LC_MONETARY=German_Germany.1252 LC_NUMERIC=C
[5] LC_TIME=German_Germany.1252

attached base packages:
[1] stats     graphics  grDevices utils     datasets  methods   base

other attached packages:
 [1] ggridges_0.5.2      rasterVis_0.48      latticeExtra_0.6-29
 [4] lattice_0.20-41     ggplot2_3.3.2       randomForest_4.6-14
 [7] groupdata2_1.3.0    tidyr_1.1.0         dplyr_1.0.0
[10] raster_3.3-13       rgdal_1.5-12        sp_1.4-2
[13] here_0.1            workflowr_1.6.2

loaded via a namespace (and not attached):
 [1] zoo_1.8-8          tidyselect_1.1.0   xfun_0.15          reshape2_1.4.4
 [5] purrr_0.3.4        colorspace_1.4-1   vctrs_0.3.2        generics_0.0.2
 [9] htmltools_0.5.0    viridisLite_0.3.0  yaml_2.2.1         rlang_0.4.7
[13] hexbin_1.28.1      later_1.1.0.1      pillar_1.4.6       glue_1.4.1
[17] withr_2.2.0        RColorBrewer_1.1-2 plyr_1.8.6         jpeg_0.1-8.1
[21] lifecycle_0.2.0    stringr_1.4.0      munsell_0.5.0      gtable_0.3.0
[25] codetools_0.2-16   evaluate_0.14      labeling_0.3       knitr_1.29
[29] httpuv_1.5.4       parallel_4.0.2     highr_0.8          Rcpp_1.0.5
[33] checkmate_2.0.0    promises_1.1.1     backports_1.1.7    scales_1.1.1
[37] farver_2.0.3       fs_1.4.2           png_0.1-7          digest_0.6.25
[41] stringi_1.4.6      grid_4.0.2         rprojroot_1.3-2    tools_4.0.2
[45] magrittr_1.5       tibble_3.0.3       crayon_1.3.4       whisker_0.4
[49] pkgconfig_2.0.3    ellipsis_0.3.1     rmarkdown_2.3      rstudioapi_0.11
[53] R6_2.4.1           git2r_0.27.1       compiler_4.0.2