Applications
Geomorphometry
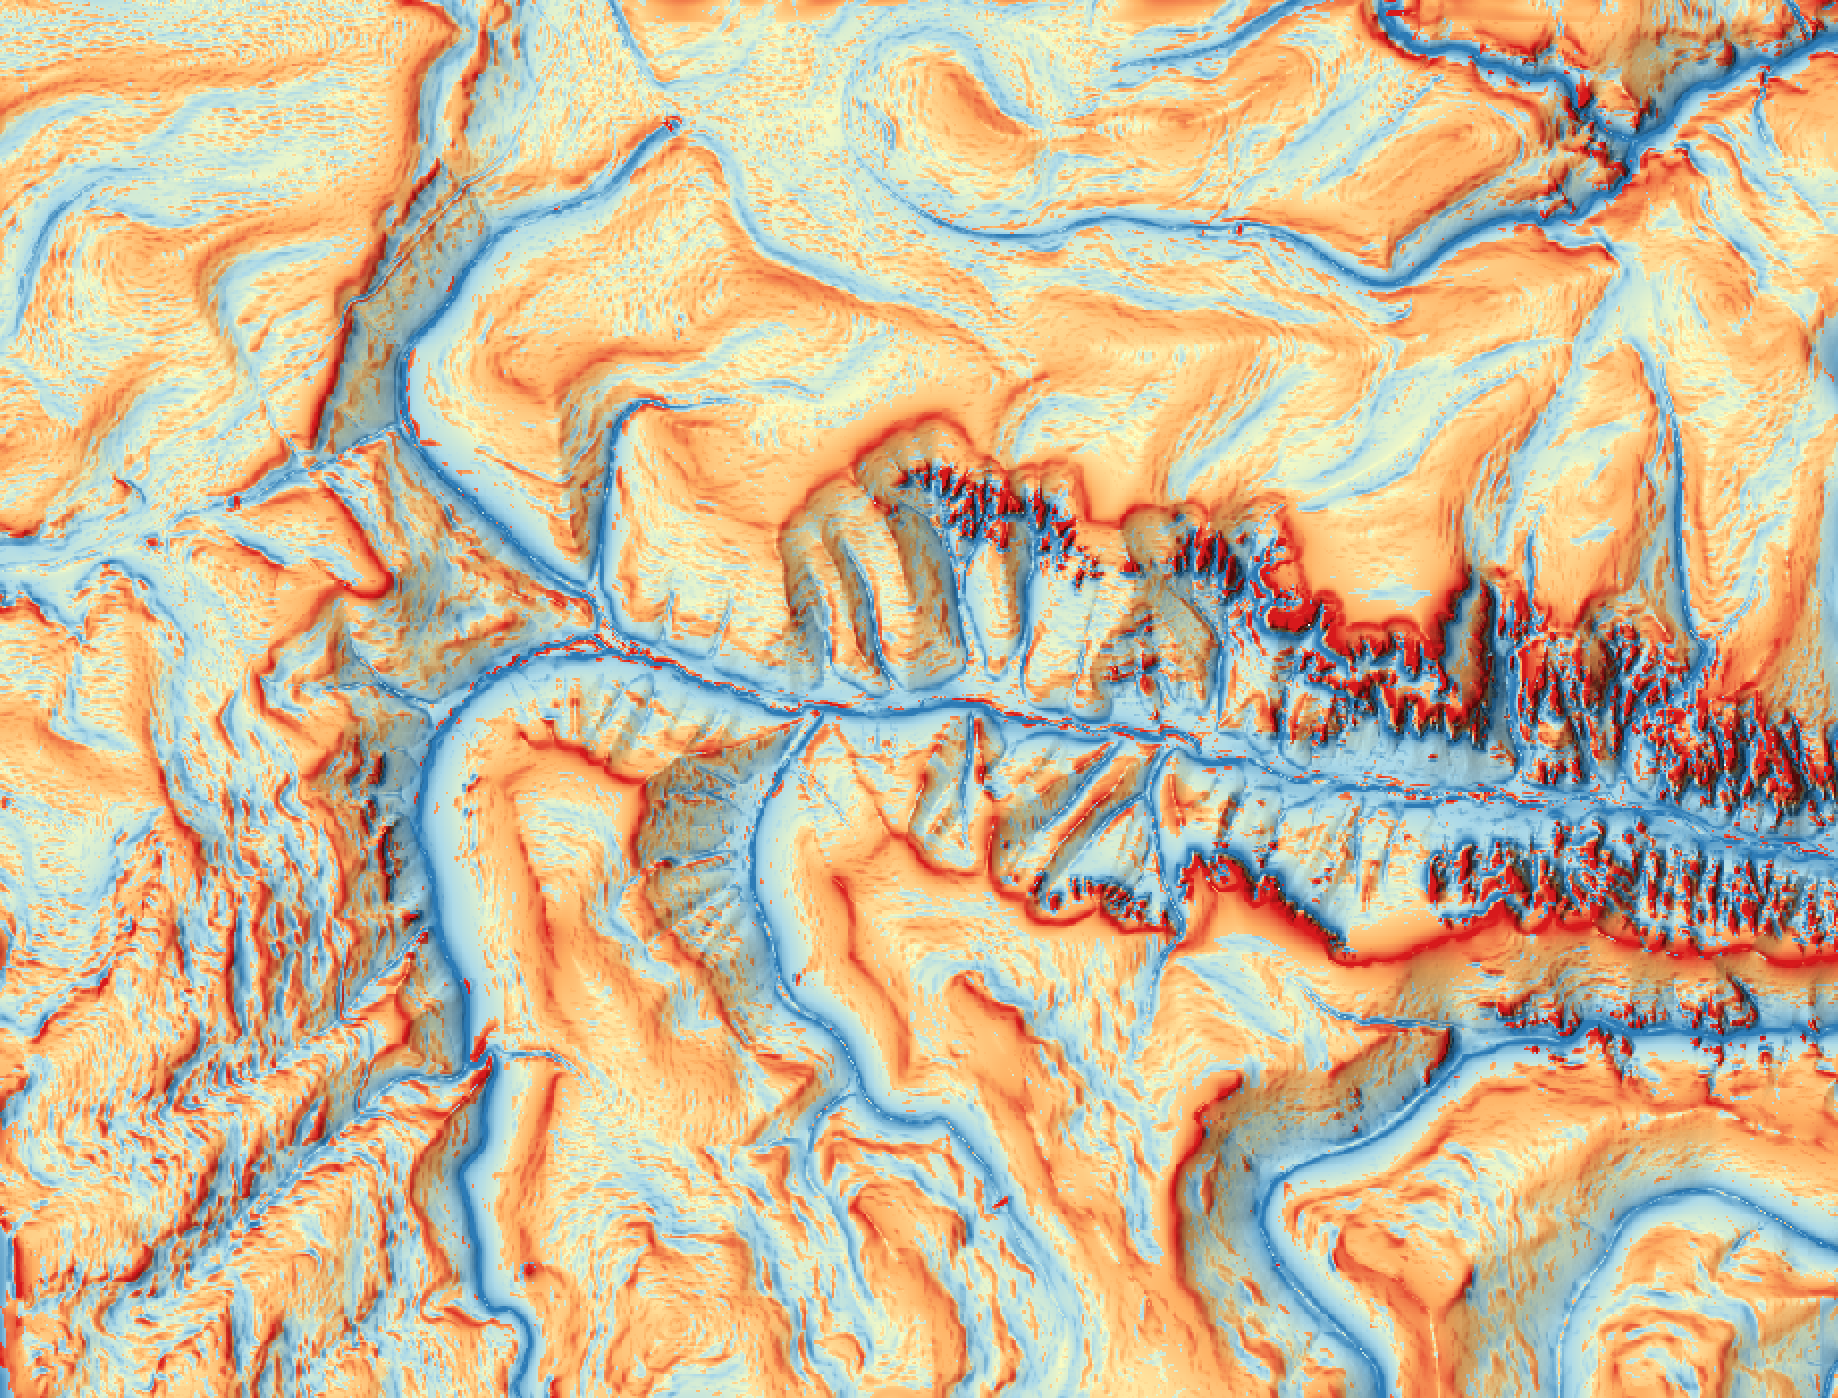
Geomorphometry is the use of quantitative methods and tools to measure, analyze, and interpret the physical characteristics of the Earth’s surface. This includes the measurement of topographic features such as elevation, slope, and aspect, as well as the characterization of landforms such as rivers, valleys, and hills. The goal of geomorphometry is to understand the processes that shape the Earth’s surface and how they have changed over time. It is applied in various disciplines such as geology, geography, environmental science, and civil engineering. The information and knowledge generated by geomorphometry can be used for a wide range of applications, such as natural resource management, land-use planning, hazard assessment, and infrastructure development. Digital Terrain Models based on ALS data are the foundation.
Lidar can be used to map cultural heritage sites (archeology, bomb craters, …)
show that imprints from past land uses and management practices can still be captured today through well-chosen LiDAR-derived variables describing, at sub-decimetre scale, the vertical and horizontal micro-variations of vegetation and terrain structure hidden below treetops. (Lenoir et al. 2022)
increasing availability of light detection and ranging data presents new opportunities to apply digital soil mapping to support forest resource applications at multiple scales. This project describes a digital soil mapping workflow using LiDAR-derived elevation data and machine learning models to predict key forest soil attributes. (Blackford et al. 2021)
Hydrology
Hydrological analysis of forests involves the study of how forests affect the movement, distribution, and quality of water. Forests play a critical role in the water cycle as they can affect precipitation, evaporation, infiltration, and runoff. They also influence the water resources such as rivers, lakes, and groundwater. The goal of hydrological analysis of forests is to understand how forests impact the water cycle, how they are affected by natural and human-induced changes, such as climate change and land-use changes and how they can be managed to protect and conserve water resources. Understanding the hydrological role of forests can provide important information for managing and protecting water resources, mitigating flood and drought risks, and planning for future water needs. Digital Terrain Models based on ALS data are an important data source for hydrological analysis.
Structural forest characterizations, digital soil mapping, and hydrological modelling, among others, provide important indicators for assessing criteria and related ecosystem services. ALS data can support these activities, which in turn, promote informed forest management decisions and the development of effective policy. (Tristan R. H. Goodbody et al. 2021)
LIDAR-derived terrain indices proved effective for mapping of forest soil moisture (Ågren et al. 2021)
(Lidberg et al. 2023; Ågren et al. 2021; Hoffmann et al. 2022; Kopecký, Macek, and Wild 2021)
Individual Tree Detection
Individual Tree Detection (ITD) is a technique that automates tree position identification for individual trees, enabling accurate estimation of tree attributes and improved forest inventory and management decisions. Precise Canopy Height Models based on ALS data are the foundation for most methods.
assessed seven ITD methods, representing three common approaches (point-cloud-based, raster-based, hybrid), across coniferous forest stands with diverse structure and composition to understand how ITD and height measurement accuracy vary with method, input parameters and data, and stand density. (Sparks, Corrao, and Smith 2022)
aimed to develop a tool for individual tree detection (ITD) utilising a self-calibrating algorithm procedure and to verify its accuracy using the complicated forest structure of near natural forests in the temperate zone. (Stereńczak et al. 2020)
This article describes algorithms to extract tree crowns using two-dimensional (2D) and three-dimensional (3D) segmentation. For all combinations of algorithms and data resolutions, undetected trees accounted for, on average, 0–5% of the total stem volume in the field plots. (Holmgren et al. 2022)
Numerous semi- and fully-automatic algorithms have been developed for individual tree detection from airborne laser-scanning data (Brodić et al. 2022)
The ALS-based tree height estimates were robust across all stand conditions. The taller the tree, the more reliable was the ALS-based tree height. (Wang et al. 2019)
A comparison of the six considered ALS-derived proxies of tree height showed that the individual tree detection approach was the most accurate. (Hawryło et al. 2024)
The study provides new insight regarding the potential and limits of tree detection with ALS and underlines some key aspects regarding the choice of method when performing single tree detection for the various forest types encountered in alpine regions. (Eysn et al. 2015)
proposed a novel ITC segmentation method based on computer vision theory which combines a dual Gaussian filter and a treetop screening strategy to achieve a flexible filtering process for varying tree sizes and the exclusion of false treetops generated by lateral branches. (Yun et al. 2021)
successfully apply a lidar-based method based on the 3D adaptive mean shift (AMS3D) technique to estimate individual tree size and density. (Ferraz et al. 2016)
ITD accuracy was high in stands with lower canopy cover and lower in stands with higher canopy cover, mainly owing to omission of suppressed trees that were not detected under the dominant tree canopy. Sparks and Smith (2021)
an individual tree detection algorithm is optimized so that the number of undetected trees and false detections is minimized Kostensalo et al. (2023)

Individual Tree Segmentation
Individual Tree Segmentation (ITS) is a technique that automatically delineates individual tree crowns, facilitating accurate tree attribute estimation and forest inventory analysis. Precise Canopy Height Models based on ALS data are the foundation for most methods.
This study compared the accuracy of four representative individual tree segmentation (ITS) algorithms against benchmark data sets in temperate and tropical forests. We found that all four ITS algorithms were able to segment canopy trees accurately but performed poorly for the understory trees (Cao et al. 2022)
propose a framework for individual tree crown (ITC) segmentation from laser data that focuses on both overstory and understory trees. achieve ITC segmentation for forests with various structural attributes. The results also illustrate the potential of using ALS data to delineate low vegetation.” (Huo, Lindberg, and Holmgren 2022)
two instance segmentation methods, Mask R–CNN and DETR, were applied to precisely delineate single tree crowns using multispectral images and images generated from UAV lidar data. (Dersch et al. 2023)
compared the performance of four widely used tree segmentation algorithms. All algorithms performed reasonably well on the canopy trees. However, all algorithms failed to accurately segment the understory trees. (Cao et al. 2023)
present a novel ITC segmentation approach based on the YOLOv5 CNN. (Straker et al. 2023)
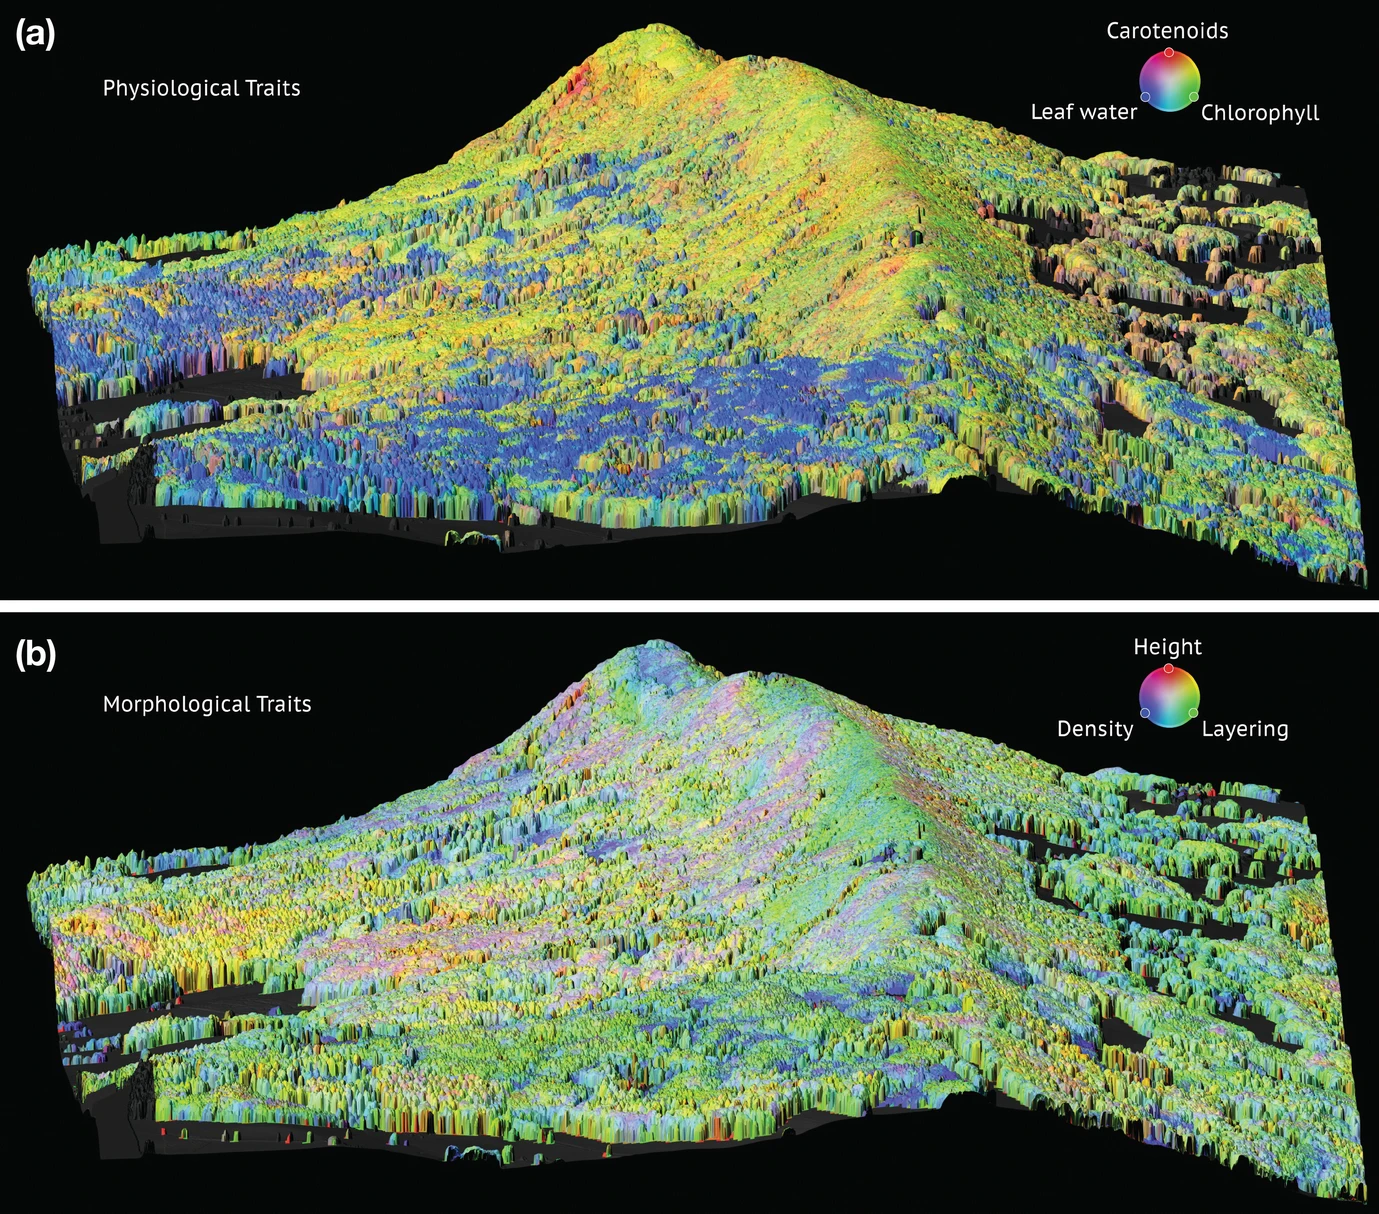
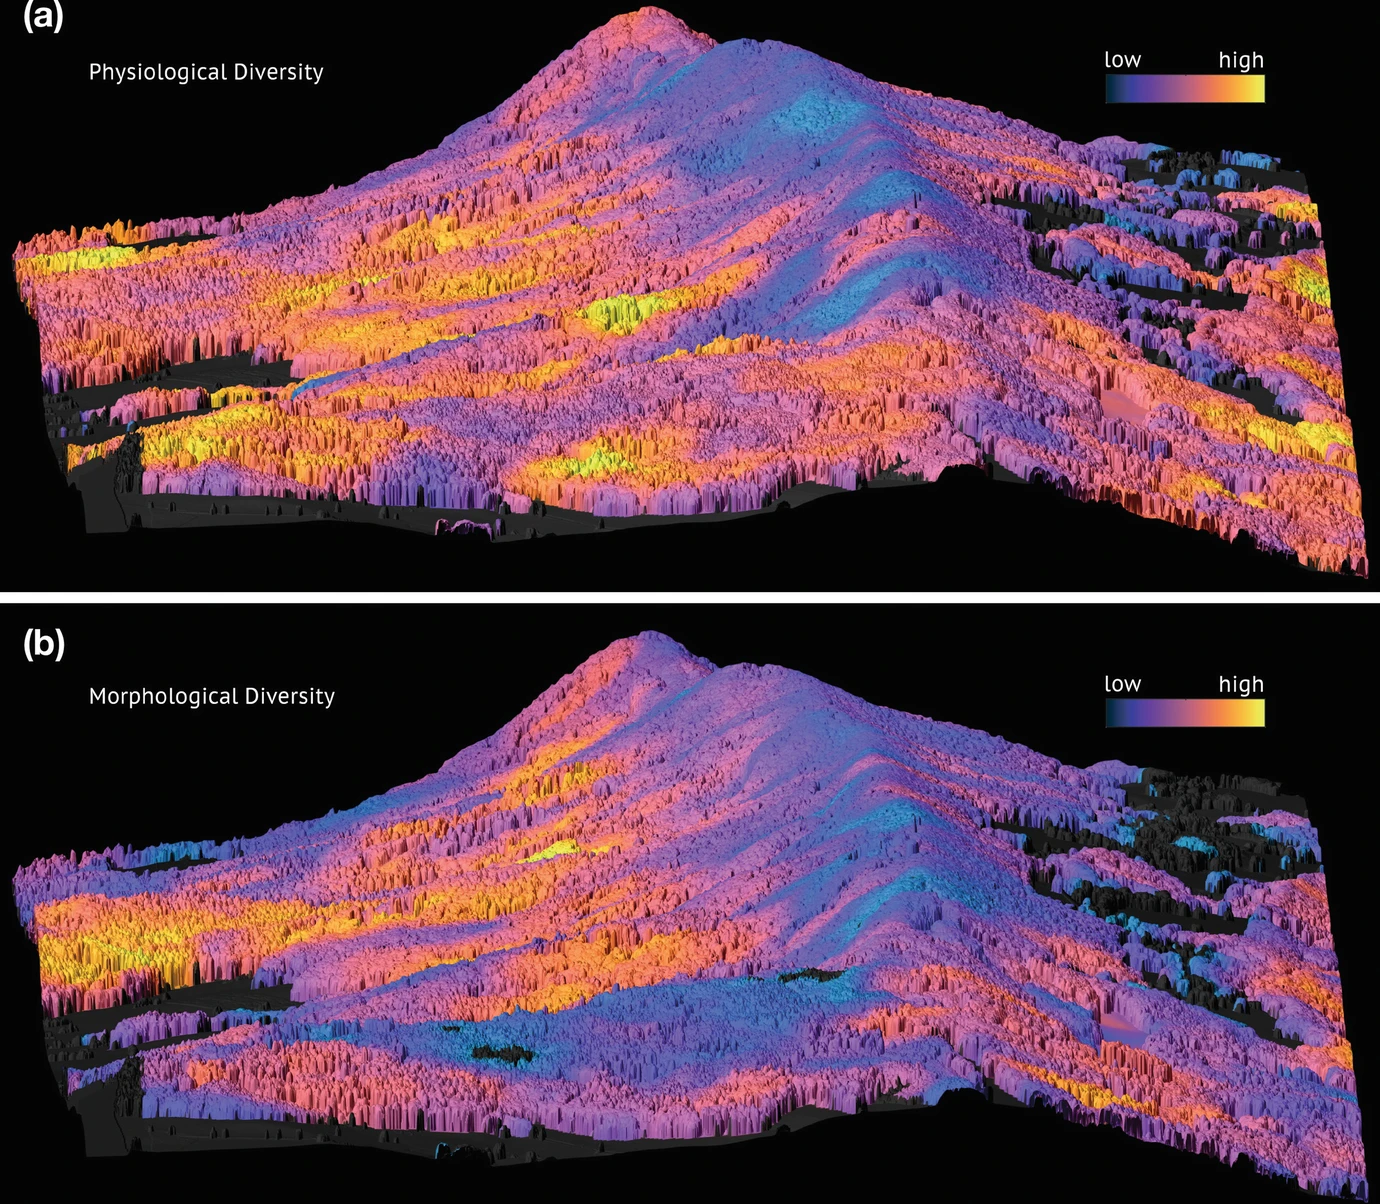
Forest structure
Ecosystem structure, especially vertical vegetation structure, is one of the six essential biodiversity variable classes and is an important aspect of habitat heterogeneity, affecting species distributions and diversity by providing shelter, foraging, and nesting sites. Point clouds from airborne laser scanning (ALS) can be used to derive such detailed information on vegetation structure. (Moudrý et al. 2023)
With the increasing density of ALS point clouds, new opportunities exist to describe sub-canopy structural components in forests that were previously difficult to detect using passive remote sensing technologies. (Lukas R. Jarron et al. 2020)
The porosity of tree belts is expressed by gap fraction under and inside the canopy. (Nowak, Pędziwiatr, and Bogawski 2022)
compare crown metrics derived from TLS, ALS, and a combination of both for describing the crown structure and fuel attributes (Rocha et al. 2023)
Recent advances in remote sensing and data processing are revolutionising our ability to accurately measure tree and forest structure from leaves to landscapes. (Lines et al. 2022)
Models utilising leaf-off LiDAR diversity variables described DBH diversity, crown length diversity and crown width diversity more successfully than leaf-on. (Davison, Donoghue, and Galiatsatos 2020)
Over the last 20+ years, lidar technology has fundamentally changed the way we observe and describe forest structure, and it will continue to impact the ways in which we investigate and monitor the relations between forest structure and functions. (Beland et al. 2019)
used the 3D data from mobile laser scanning in real forest stands dominated by European beech (Fagus sylvatica L.) to simulate different silvicultural treatments and assess their impact on the structural complexity and short-term economic return (Neudam et al. 2023)
national ALS data with a point density of 0.91 pulses per square metre, we carried out a classification of boreal forests into silvicultural development classes (DC) used in practical forest management. We conclude that the dataset is adequate for discriminating multilayered forests from even-aged ones. (Valbuena, Maltamo, and Packalen 2016)
LiDAR sensors, can provide very detailed vertical and horizontal information on canopy structure and layering (Camarretta et al. 2020)
used single-photon LiDAR data to automate the mapping of vertical stand layering in a temperate mixedwood forest with a variety of forest types and vertical complexities. (Penner, White, and Woods 2023)
To identify forests with high conservation value, we used vertical and horizontal variables derived from airborne laser scanning (ALS) data, along with NFI plot measurements. (Jutras-Perreault et al. 2023)
Lidar’s capabilities to measure vegetation structure in detail across wide areas are shifting the paradigm of how forests are analyzed, and the technology is now being adopted as a foundational data collection method for forest management in the same way aerial photography was more than half a century ago. (Kane, Van Wagtendonk, and Brenner 2022)
review the measurement of forest structure and structural diversity (Atkins et al. 2023)

Forest canopy gaps
report large-scale estimates of Amazonian gap dynamics using a novel approach with large datasets of airborne light detection and ranging (Dalagnol et al. 2021)
compared the performance of LiDAR and DAP data for characterizing canopy openings. recommend that operational use of DAP in forests be limited to mapping large canopy openings (Dietmaier et al. 2019)
DAP data do not provide analogous results to ALS data for canopy gap detection and mapping, and that ALS data enable markedly superior accuracy and detailed gap characterizations. (Joanne C. White et al. 2018)
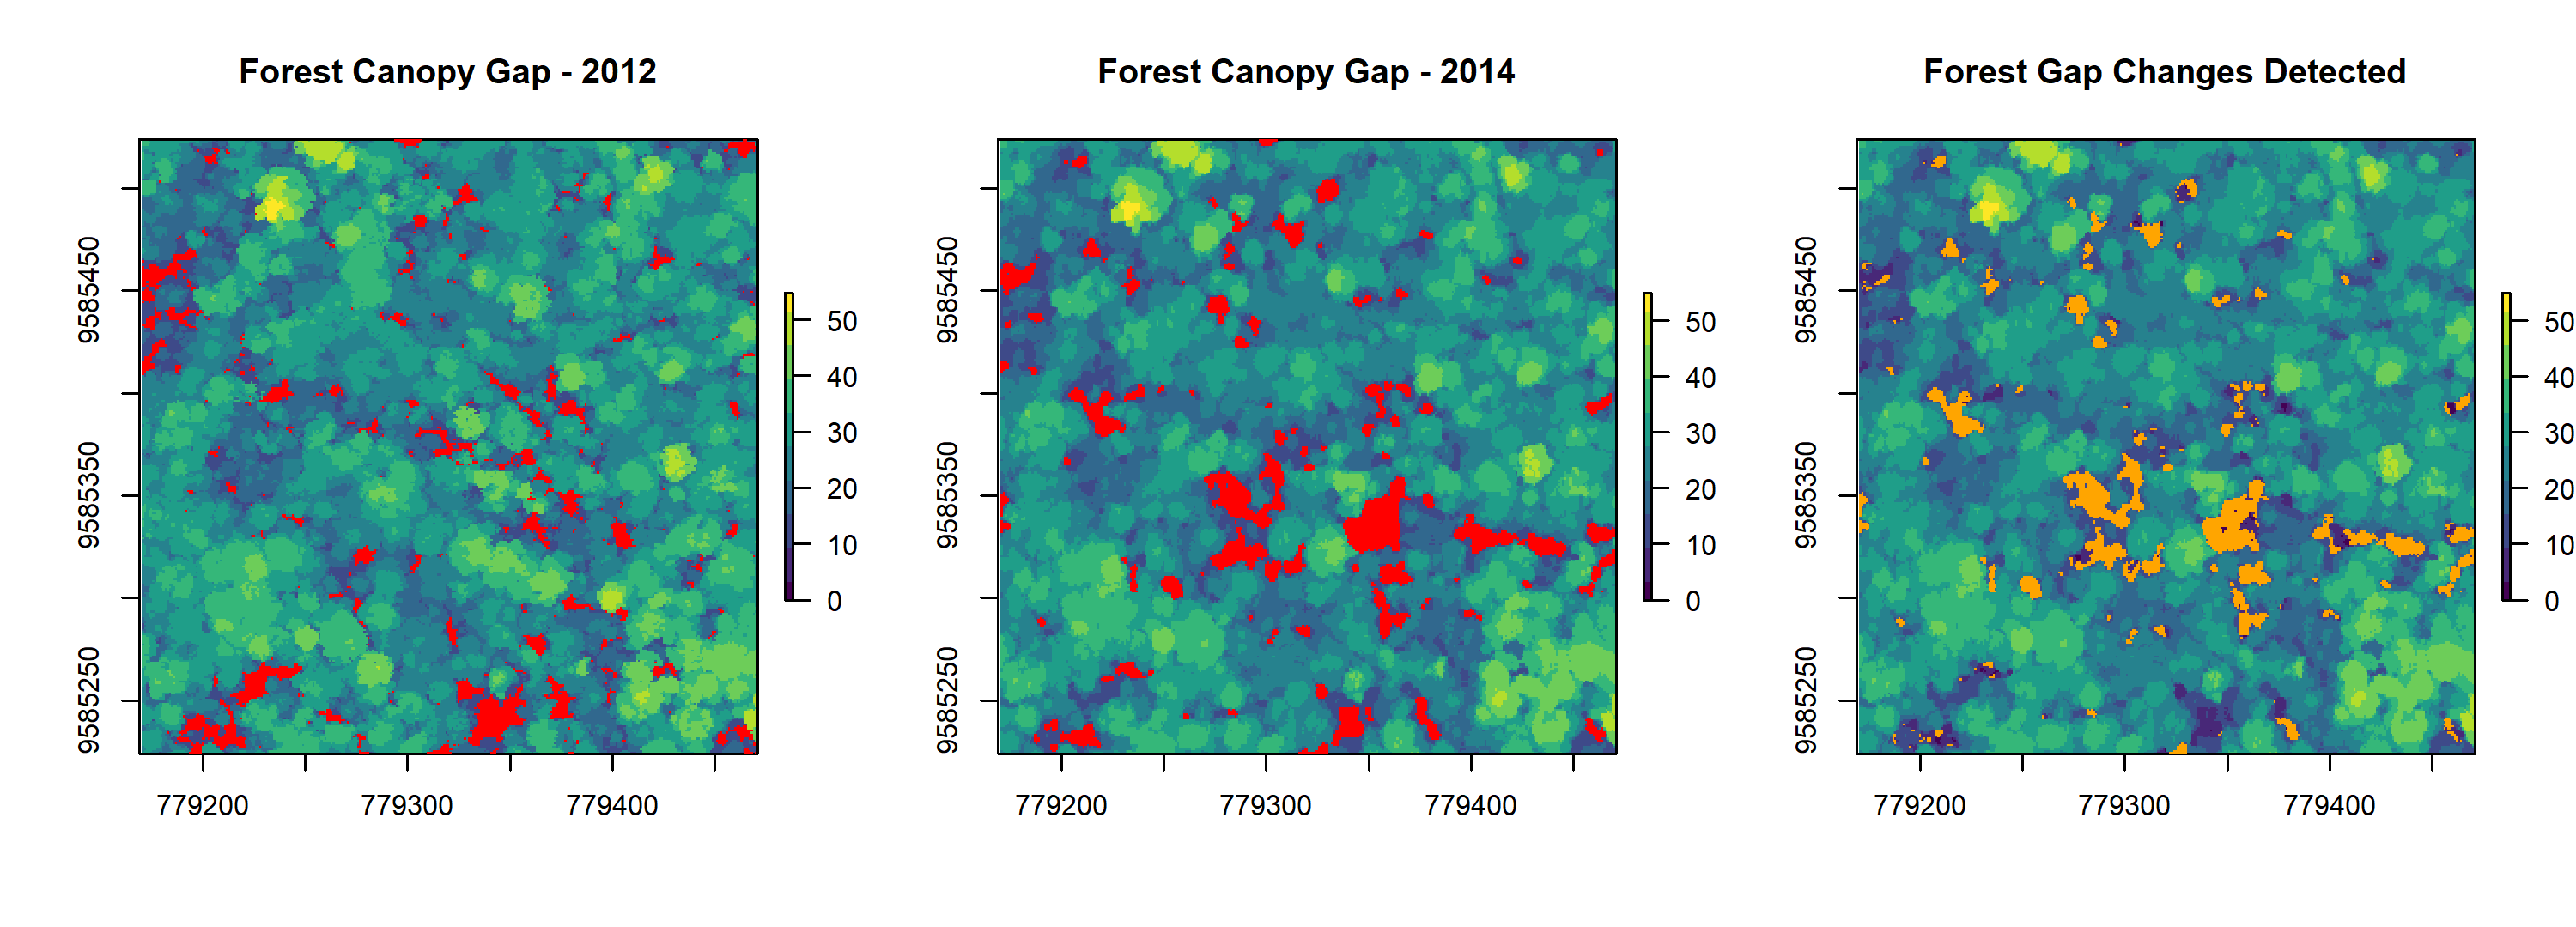
ForestGapR: An r Package for forest gap analysis from canopy height models (Silva et al. 2019)
Leaf Area Index
airborne laser scanning can be applied to map effective leaf area index (Solberg et al. 2009)
Airborne Laser Scanning has been considered as a primary source to model the structure and function of a forest canopy through the indicators leaf area index (LAI) and vertical canopy profiles of leaf area density (LAD). Stable LAD profile were obtained when the grain size was less than 10 m and pulse density was high (>15 pulses m²). (in tropical forests) (Almeida et al. 2019)
LAD estimates from airborne LiDAR can be used to describe the three-dimensional structure of forests across entire landscapes. This information can help inform forest management and conservation decisions related to the estimation of aboveground biomass and productivity, the response of forests to large-scale disturbances, the impacts of drought on forest health, the conservation of bird habitat, as well as a host of other important forest processes and responses. (Kamoske et al. 2019)
canopyLazR: R package to estimate leaf area density (LAD) and leaf area index (LAI) from airborne LiDAR point clouds
Biomass estimation
Laser scanning reveals potential underestimation of biomass carbon in temperate forest (Calders et al. 2022).
Current allometry has low sample size and excludes large trees. Terrestrial LiDAR precisely and non-destructively estimates tree biomass. We developed high sample size species-specific allometry with terrestrial LiDAR. (Stovall et al. 2023)
even with the highest average pulse density of 11 pulses/m², at least 25% of the forest canopy volume remains occluded in the ALS acquisition under leaf-on conditions (Kükenbrink et al. 2017)
practical solutions to challenges faced in using spatiotemporal patchworks of LiDAR to meet growing needs for AGB prediction and mapping in support of broad-scale applications in forest carbon accounting and ecosystem stewardship (Johnson et al. 2022)
national forest inventory (NFI) data was used as reference data for modeling forest basal area, volume, above-ground biomass, and total biomass from laser scanning data obtained in a countrywide scanning survey. (Nord-Larsen and Schumacher 2012)
this study confirm the utility of LiDAR for estimating wood volume in deciduous broad-leafed forest, but highlight the challenges associated with field plot size and number (Levick, Hessenmöller, and Schulze 2016)
found TLS biomass estimates were consistently more precise across species (RMSE = ~19%) than nation-scale allometry (RMSE = ~39%). Nondestructive biomass estimates from TLS are a suitable addition to or replacement for traditional sampling methods. Although optical and airborne LiDAR are unable to fully capture understorey trees due to occlusion, the easily measured canopy trees dominate the biomass. (Stovall et al. 2023)
accounted for uncertainties in both the individual tree-level biomass models and the models linking plot level biomass predictions with LiDAR metrics. 75% of the mean square error was due to the uncertainty associated with tree-level models. (Saarela et al. 2020)
ground filtering should be a carefully considered decision when mapping forest AGB, particularly when mapping heterogeneous and highly fragmented landscapes (Mahoney et al. 2022)
Estimating the above-ground biomass in forests using airborne laser scanning (ALS) is now an operational practice in Northern Europe and is being adopted in many parts of the world. ALS data can be used indirectly through a chain of models to estimate soil carbon changes in addition to changes in biomass at the primary level of forest management, namely the forest stands. (Strîmbu et al. 2023)
Dual-wavelength ALS was used in a two-step methodology to classify species, and estimate species-specific stem volume at the level of individual tree crowns. Demonstrate the added benefit of the green channel for the estimation of both species composition and species-specific stem volumes. (Axelsson et al. 2023)
errors in species composition have less impact on individual tree volume estimates than errors in height measurement. The implications of these results are that, with very accurate estimates of height provided by ALS and knowledge of what dominant species is expected in a stand, accurate estimates of volume can be generated in the absence of more detailed species composition information. (Tompalski et al. 2014)
simulated data cannot yet replace real data but they can be helpful in some sites to extend training datasets when only a limited amount of real data is available. (Schäfer et al. 2023)
this study showcases the effectiveness of additive tree AGB models and highlights the potential of DNNs for enhanced AGB estimation. Compared deep learning and random forest models in terms of biomass estimation. Deep neural networks provided small performance gain compared to random forest. (Seely et al. 2023)
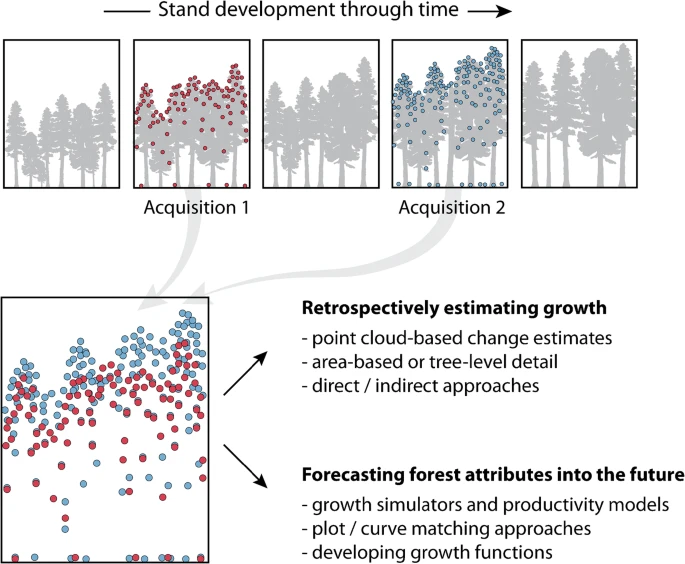
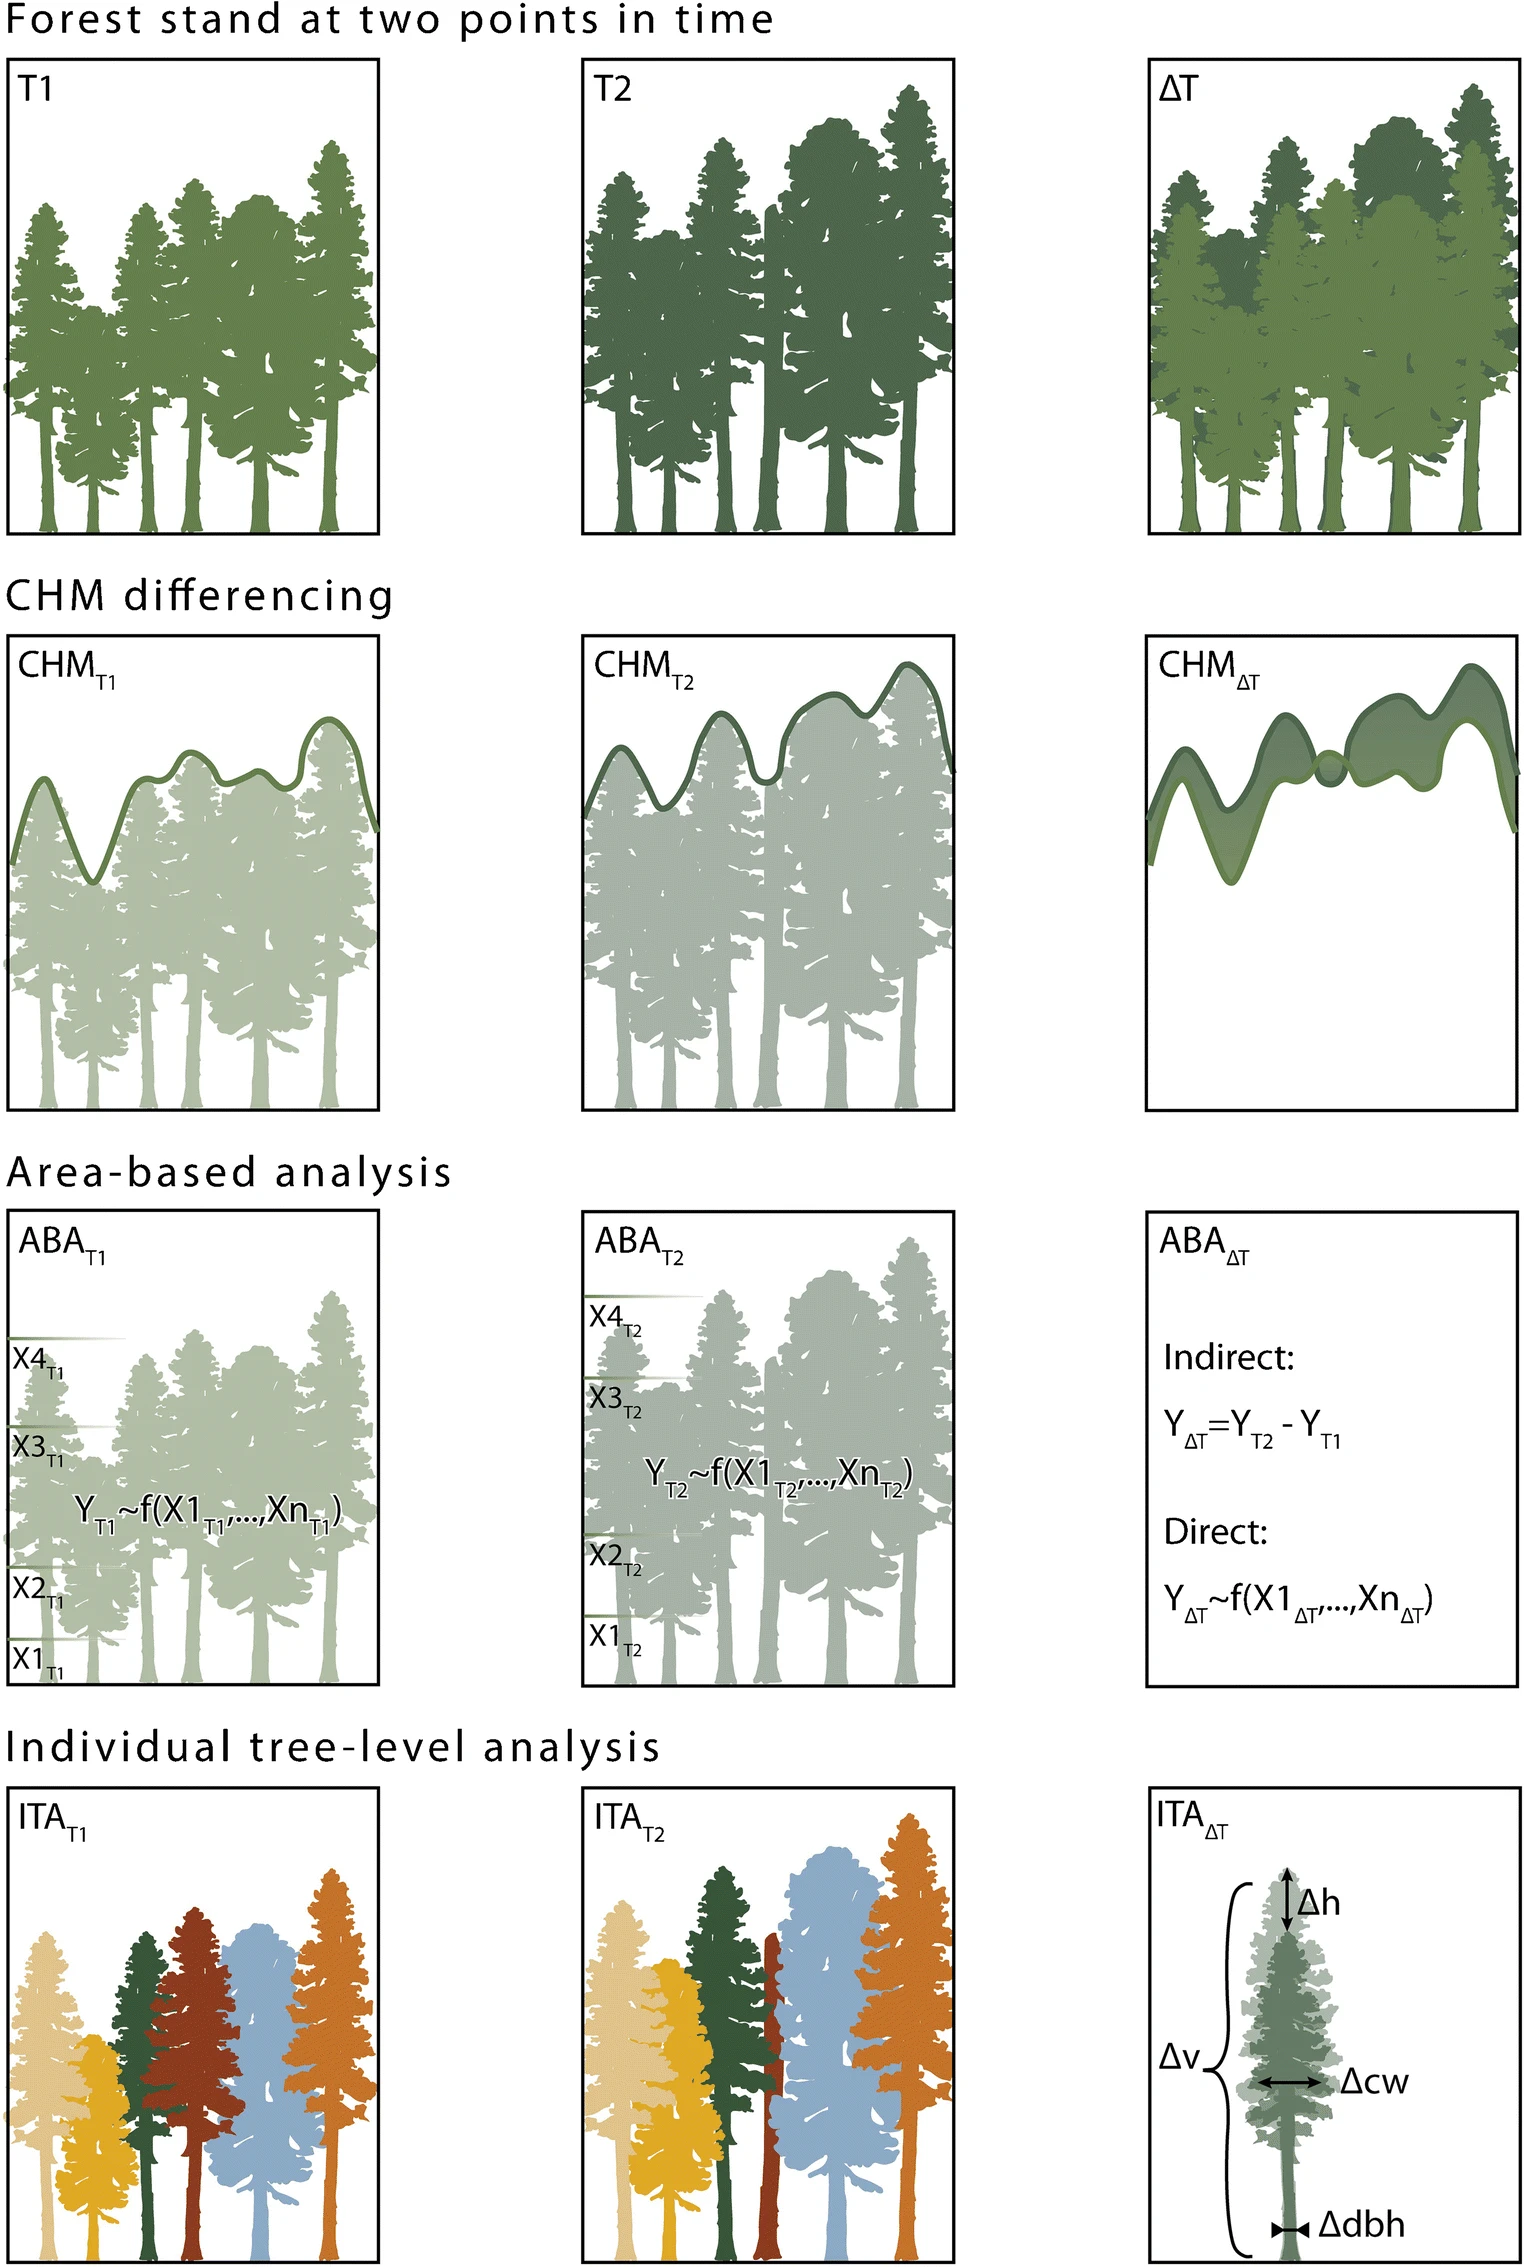
Tree Growth
Using repeat airborne LiDAR to map the growth of individual trees and forest stands
use spatially explicit information on tree location and competition to forecast potential tree height, defined as a maximum projected tree height at rotation age (Gavilán-Acuña et al. 2022)
The height growth of >500,000 individual oil palms was mapped using repeat LiDAR. (Beese et al. 2022)
prediction of the periodic annual increment (PAI) of the width of tree rings over a period of 10 years. (Maltamo et al. 2022)
importance of assessing and harmonizing the vertical alignment of multi-temporal ALS data sets used for height growth calculations (Riofrío et al. 2022)
it is possible to determine long-term diameter and stem volume growth values of individual trees from bitemporal airborne laser scanning point cloud data with reasonable accuracy, apart from height growth, which can be obtained with high accuracy (Soininen et al. 2022)
with TLS data acquisition and existing point cloud processing methods, it is possible to observe seasonal increments in tree structures (Yrttimaa et al. 2023)
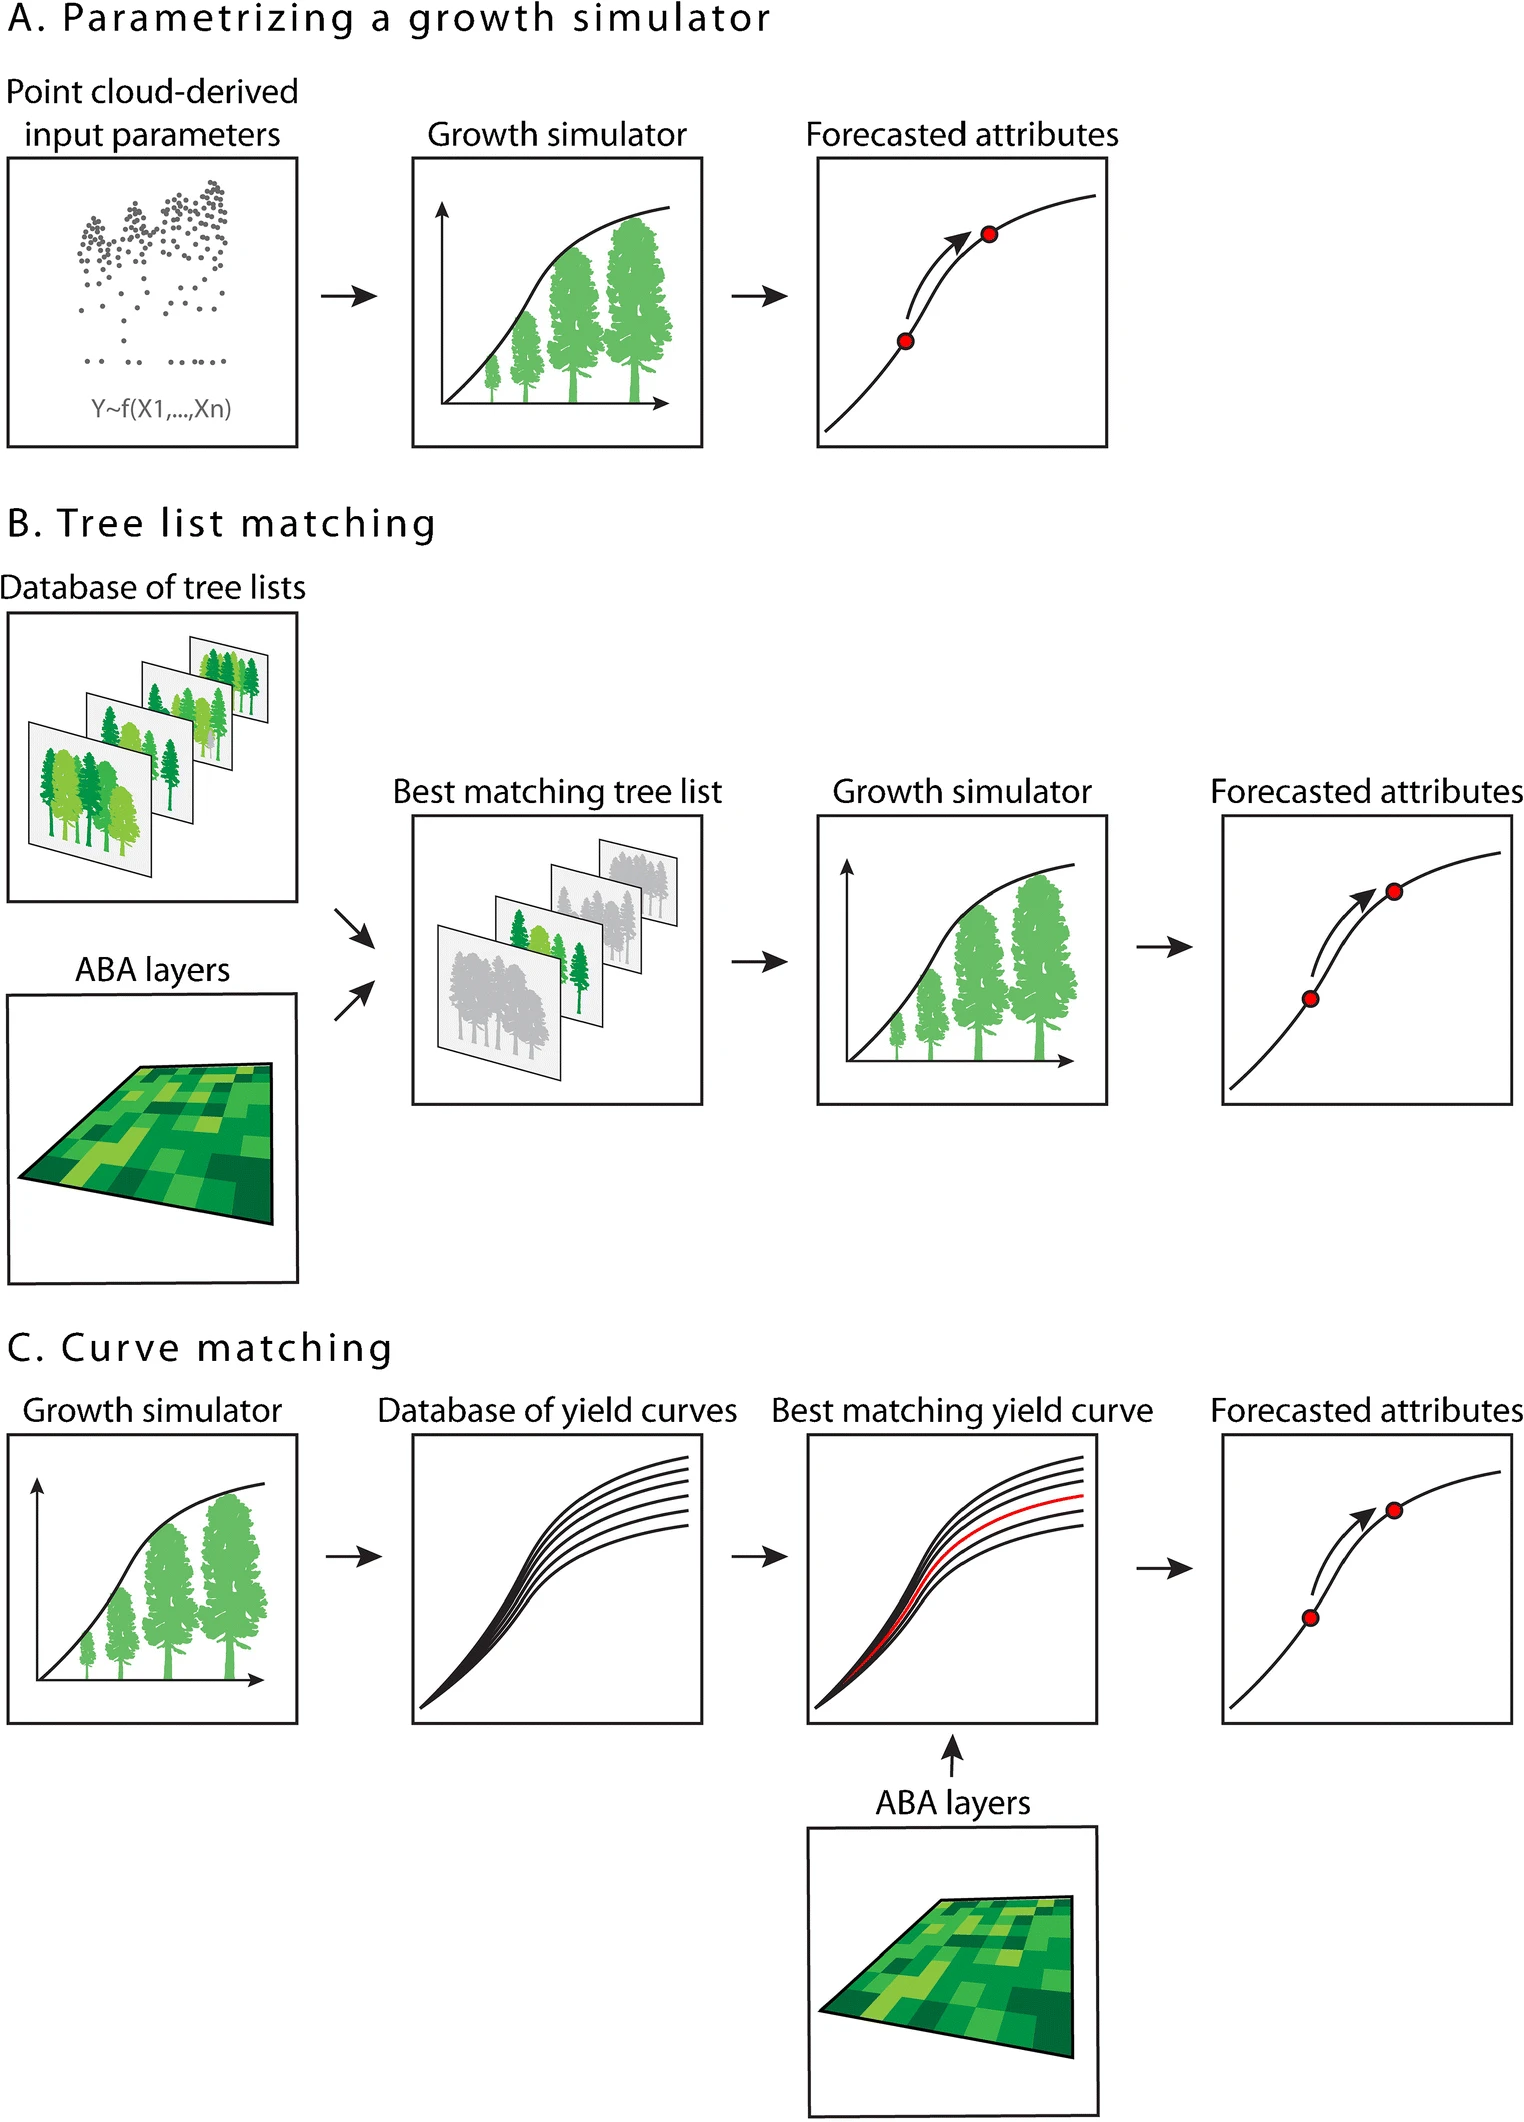
This study explored the use of point cloud-derived forest inventory information, representing two points in time, to find the best matching yield curve at a 20 by 20 m cell level to support growth simulation modelling. (Tompalski et al. 2018)
used a combination of fire behavior and heat flux metrics, along with multitemporal field and ALS measurements to quantify fire intensity impacts on mature tree height growth (Sparks et al. 2023)
Terrestrial laser scanning (TLS) opens up the possibility of describing the three-dimensional structures of trees in natural environments with unprecedented detail and accuracy. It is already being extensively applied to describe how ecosystem biomass and structure vary between sites, but can also facilitate major advances in developing and testing mechanistic theories of tree form and forest structure, thereby enabling us to understand why trees and forests have the biomass and three-dimensional structure they do. (Malhi et al. 2018)

Standing dead trees
Among the available RS techniques, only the airborne laser scanner (ALS) enables dead tree detection at the single tree level with high accuracy. (Kamińska et al. 2018)
demonstrates the feasibility of large-scale and high-accuracy mapping of single conifers, broadleaf trees, and standing dead trees using lidar and aerial imagery. (Krzystek et al. 2020)
ALS data can be used to separate disturbed from undisturbed forest areas with moderate to high accuracy in complex temperate mixedwood forests (Moan et al. 2023)
Coarse woody debris
a novel methodology that isolates CWD returns from large diameter logs (>30cm) using a refined grounding algorithm, a mixture of height and pulse-based filters and linear pattern recognition, to transform ALS returns into measurable, vectorized shapes. (Lukas R. Jarron et al. 2021)
Fallen tree mapping provides valuable information regarding the ecological value of boreal forests. Airborne laser scanning (ALS) enables mapping fallen trees on a large scale. (Heinaro et al. 2023)
Our results demonstrate that airborne LiDAR can be used to detect CWD. LiDAR-based detection and mapping of CWD will be most useful for applications that focus on larger and longer pieces of CWD or applications focused on total CWD volume. (Joyce et al. 2019)
Moderate-density LiDAR data enables detecting ecologically most significant trunks. (Heinaro et al. 2021)
ALS-detected deadwood can indicate forest conservation value. ALS data can be used to map forest conservation values and inform decisions about which forests should be used for timber production and which should be set aside as conservation areas. (Huo et al. 2023)

Tree species mapping
mapping of tree species—subdivided into conifers and broadleaf trees (Krzystek et al. 2020)
This paper compares the same method of tree species identification (at the individual crown level) across three different types of airborne laser scanning systems (ALS): two linear lidar systems (monospectral and multispectral) and one single-photon lidar (SPL) system. The additional intensity features that are provided by multispectral ALS appear to be more beneficial to overall accuracy than the higher point density of SPL. (Prieur et al. 2021)
laser scanning data was used to mask pixels with low or no vegetation (Trier et al. 2018)
Deciduous trees displayed substantial between-species variation that was linked with differences in branching pattern, leaf orientation and bark reflectance. Our results provide new insights for enhancing tree species identification by using WF LiDAR and for LiDAR time-series analysis of vegetation. (Korpela et al. 2023)
the addition of 3D derivatives (from LiDAR or photogrammetry) could help segregate between different species if these species have different architectural properties. (Camarretta et al. 2020)
objective of this study was to map dominant species groups across a large (>580,000 ha) boreal forest by combining area-based and individual tree metrics derived from single photon LiDAR data with multispectral information derived from Sentinel-2 imagery (Queinnec et al. 2023)
presents a method of tree species classification using individual tree metrics derived from a three-dimensional point cloud from unmanned aerial vehicle laser scanning (ULS) (Slavík et al. 2023)
The fusion of spectral information from optical images and the structural information provided by ALS was highly advantageous in studies where tree species were considered. (Toivonen et al. 2023)
estimate tree species compositions in a Canadian boreal forest environment using ALS data and point-based deep learning techniques. (Murray et al. 2024)
Biodiversity
LiDAR technology has proved to be powerful when assessing forest structural parameters, and it may be a promising way to identify existing overmature forest patches over large areas. We first built an index combining several forest structural maturity attributes in order to characterize the structural maturity. (Fuhr et al. 2022)
Canopy roughness, ground vegetation vertical complexity, total vegetation volume and canopy height derived from lidar sensors were among the most common significant variables in explaining avian diversity and individual species abundance. (Shokirov et al. 2023)
Continued emphasis to enhance forest stewardship is promoting novel methods to integrate ALS to detail non-timber ecosystem values like habitat, soil, and water. review and highlight the value of ALS for quantifying indicators of biological diversity, ecosystem condition and productivity, soil and water, and the role of forests in global ecological cycles. (Tristan R. H. Goodbody et al. 2021)
Combining satellite and airborne remote sensing data outperforms single data sources for habitat mapping significantly. (Iglseder et al. 2023)
Light detection and ranging (LiDAR) technology has the potential to radically alter the way researchers and managers collect data on wildlife–habitat relationships. To date, the technology has fostered several novel approaches to characterizing avian habitat. approach provide a useful framework to extract detailed and reliable habitat attributes for a forest-dwelling habitat specialist, broadening the potential to apply LiDAR in conservation and management of wildlife populations. (Garabedian et al. 2014)
To understand time-lag dynamics in the response of biodiversity to contemporary environmental changes (e.g. macroclimate warming and atmospheric pollution), we need to consider former anthropogenic forcing factors such as past land uses and management practices. We encourage plant and soil ecologists to use LiDAR data to account for time-lagged biotic responses to long-term macro-environmental changes. (Lenoir et al. 2022)
demonstrated innovative techniques to semi-automatically classify forest structure and rapidly quantify soundscape characteristics and found a weak effect of forest edge structure on bird biophony. (Verhelst et al. 2023)
present a new spatially continuous method to map regional patterns of tree functional diversity using combined laser scanning and imaging spectroscopy. (Schneider et al. 2017)
The main objective of this review was to summarise the use of airborne laser scanning (ALS) data in biodiversity-related assessment of forests. Topics that have received the most attention were related to animal ecology, assessment of dead trees and tree species diversity measures.Relevant ALS variables were found to be case-specific, so variables varied widely between forest biodiversity studies. (Toivonen et al. 2023)
Forest Sampling Inventory (Management Inventory)
The increased availability of wall-to-wall ALS data is promoting the concept of structurally guided sampling (SGS), where ALS metrics are used as an auxiliary data source driving stratification and sampling within management-level forest inventories. (Tristan R. H. Goodbody et al. 2023a)
study demonstrates the utility of the SPL100 for the complete development of a forest inventory over large forest areas, from ground plot establishment through to the production of forest attribute estimates. (Queinnec et al. 2022)
for equal area square and circular plots, there is no evidence of systematic prediction error when a model fitted to one shape is used to predict for the other shape. (Packalen et al. 2023)
introduce a workflow to estimate the pixel-level mean and variance in AGB maps by propagating uncertainty from a lidar-based model using small plots (Cushman et al. 2023)
Forest Stand Inventory
Integration of Photo Interpreted and LIDAR Attributes into a Polygonal Forest Inventory Framework (https://bermane.github.io/ontario-inventory/)
increasing availability of three-dimensional point clouds allow for the derivation of forest inventory information with a high level of attribute accuracy and spatial detail. (Tompalski et al. 2021)
the degree of transferability depends more on the attribute being modelled or the modeling approach applied, and less on the characteristics of the point cloud data. (Tompalski et al. 2019)
dense Laser scanning-based inventory provided more accurate stand estimates than field-based demonstrations (Persson, Olofsson, and Holmgren 2022)
explore the potential of LiDAR and other geospatial information sources to model and predict wood quality based on individual-tree and stand structural metrics. (van Leeuwen et al. 2011)
Contemporary inventory data demands are shifting, with an increased focus on accurate attribute estimation via the integration of advanced remote sensing data such as airborne laser scanning (ALS). a conceptual framework for forestry inventory update, which is also known as the establishment of a ‘living inventory’. (Nicholas C. Coops et al. 2023)
detailed forest information from ALS point clouds is useful to indicate regions not suitable for forest operations (Görgens et al. 2020)
predict the need for commercial thinning using airborne lidar data. This study offers a novel approach for planning commercial thinnings using ALS-based structure metrics in order to most effectively utilize the information with the highest acquisition cost—the decisions made in situ by forest inventory experts. (Arumäe et al. 2022)
Mobile laser scanning has yet to be demonstrated for deriving stem curve and volume from standing trees with sufficient accuracy for supporting forest inventory needs. We tested a new approach based on pulse-based backpack mobile laser scanner. The findings are important steps towards future individual-tree-based airborne laser scanning inventories which currently lack cost-efficient and accurate field reference data collection techniques. (Hyyppä et al. 2020)
goal is to inform and enable readers interested in using Airborne Laser Scanning data to characterize, in an operational forest inventory context, large forest areas in a cost-effective manner. (Joanne C. White et al. 2017)
Use of auxiliary ALS metrics substantially improved sampling efficiency. methods can aid practitioners in planning cost-effective and statistically rigorous forest inventory campaigns, particularly in determining where to re-sample within an existing plot network. (Tristan R. H. Goodbody et al. 2023b)
compared four inventory approaches for imputing stem frequency distributions from airborne laser scanner (ALS) data. Accuracies obtained using the semi-ITC, ABA and EABA inventory approaches were significantly better than accuracies obtained using the ITC approach. (Noordermeer, Ørka, and Gobakken 2023)

Site Index
Integrating multi-temporal ALS data and an age-independent approach allows for the mapping of height increments over large areas at a finer spatial resolution than is commonly possible with conventional forest inventory data and stand-level, age-dependent, models. Moreover, the growth rate index provides a continuous measure of site quality at a high spatial resolution that can be readily used in forest growth and yield modeling. The approach developed and demonstrated here can be adapted to multi-sensor data sources (ALS and DAP) that would increase the data available to support spatially explicit characterizations of height and height growth over large spatial extents. (Riofrío et al. 2023)
map Site Index over large areas of forest automatically, depicting forest productivity at a much finer spatial resolution than what is common in operational inventories. (Noordermeer et al. 2020)
an approach to develop Site Index models from ALS data (Tompalski et al. 2022)
excluding disturbed forest areas significantly improves fit statistics of SI prediction models. (Moan et al. 2023)
explored the potential of bi-temporal ALS data and other auxiliary information to predict and map site productivity by site index according to site properties. Final predictors of site index include metrics of 90th percentile height and annual increment in the 95th percentile height, altitude, distance to coast, and soil moisture. (Appiah Mensah et al. 2023)

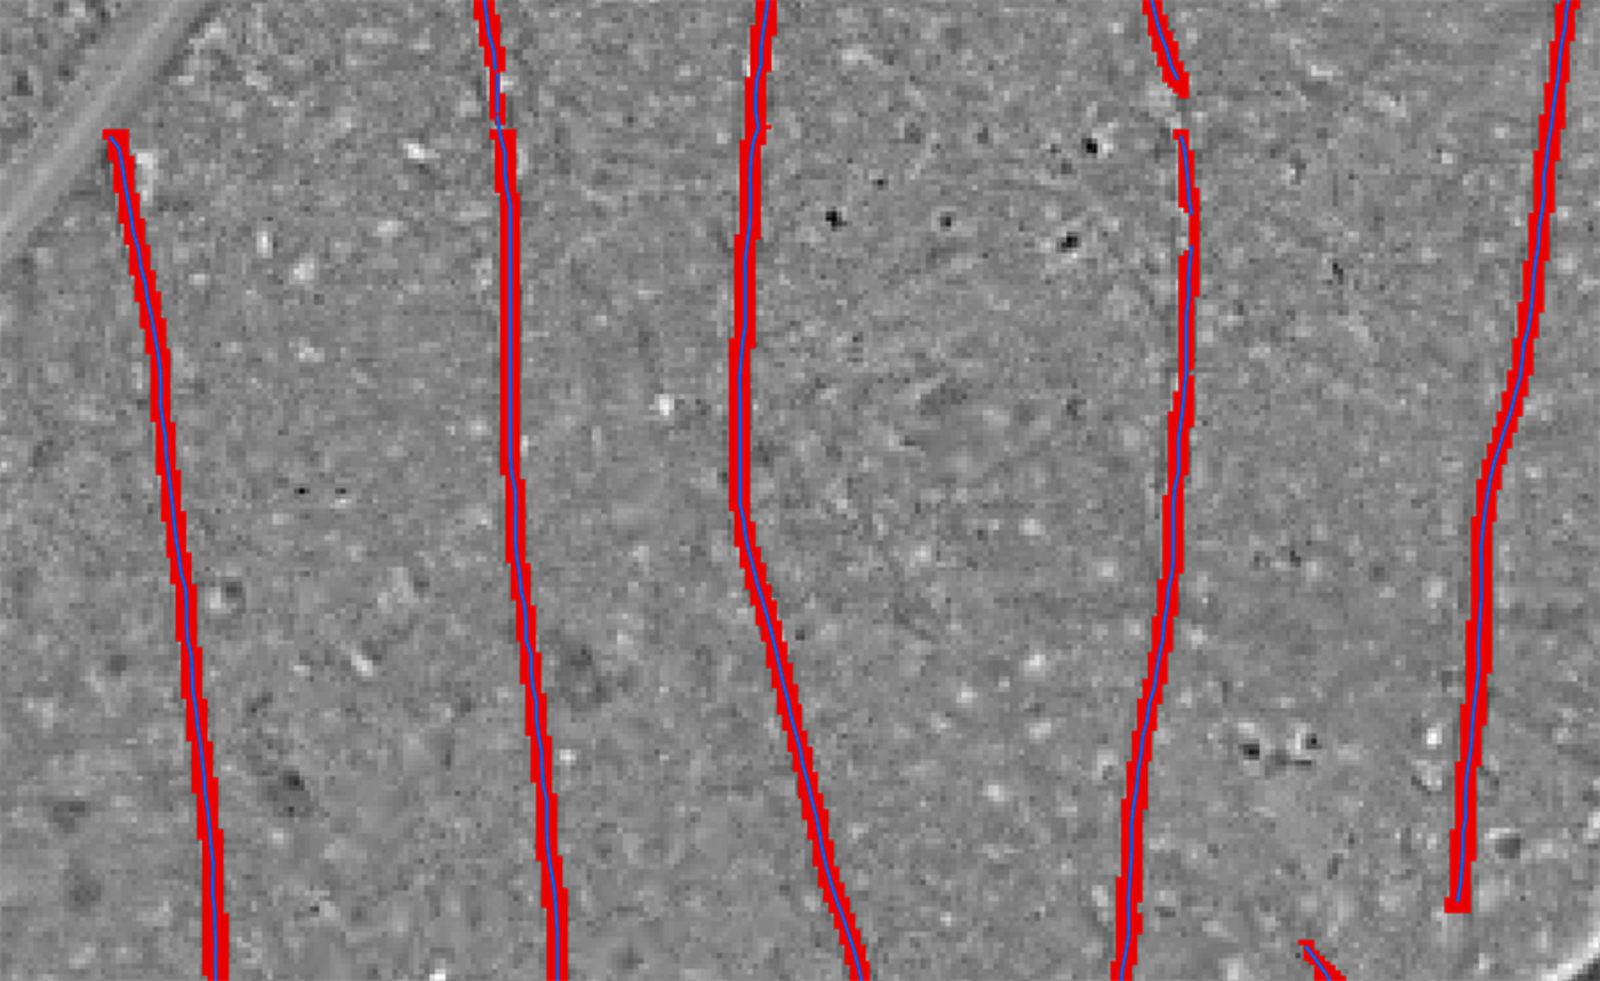
Forest track detection
Project IntelliWay – Intelligente Wege – Condition Monitoring and Predictive Maintenance for forest tracks (https://kwf2020.kwf-online.de/portfolio/intelliway/)
ALSroads provides tools to relocate, measure and estimate the state of forestry roads from an inaccurate map. It addresses the problem of the automatic updating, fixing, and enhancement of vectorial forestry road maps over large landscapes (Roussel et al. 2022)
addresses the limitations of raster-based automatic forest road extraction and presents a method for producing a topologically accurate vectorial road network. (Roussel et al. 2023)
We use airborne laser scanning (ALS), to facilitate the identification of forest roads across densely forested landscapes. We categorized roads into four classes based on driveable width, edge vegetation, as well as surface and edge degradation as derived from high-density Single Photon LiDAR (SPL) data. (Morley et al. 2023)

Forest skid road detection
In order to protect the forest floor and to help with planning tasks, a detailed skid road network is being digitized in the canton of Aargau. With the help of the detailed skid road network recorded so far, an image recognition model was trained in order to automatically map the detailed skid road network over the rest of the canton. The model reliably recognized around 90 percent of the visible lanes. The data is used to create work orders or logging sketches and is made available to machinists in the on-board GPS. https://github.com/RaffiBienz/skidroad_finder(Bienz and Freuler 2022)
proposed the use of a LiDAR-derived rutting index, based on the cumulative length of ruts (CLR), to assess and monitor soil compaction across large spatial extents by means of airborne remote sensing. (Mohieddinne et al. 2023)
OGF offers the digitalization of skid road tracks from ULS as a service as part of forest stand inventories (OGF drone team 2022)
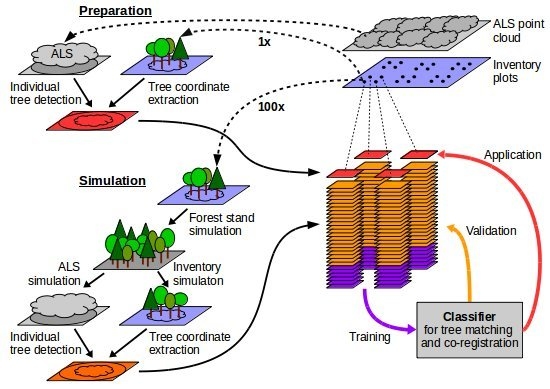
Co-registration of forest plots
develop a post-processing strategy to improve the positional accuracy of GNSS-measured sample-plot centers and to develop a method to automatically match trees within a terrestrial sample plot to aerial detected trees. (Lamprecht et al. 2017)
Shading conditions
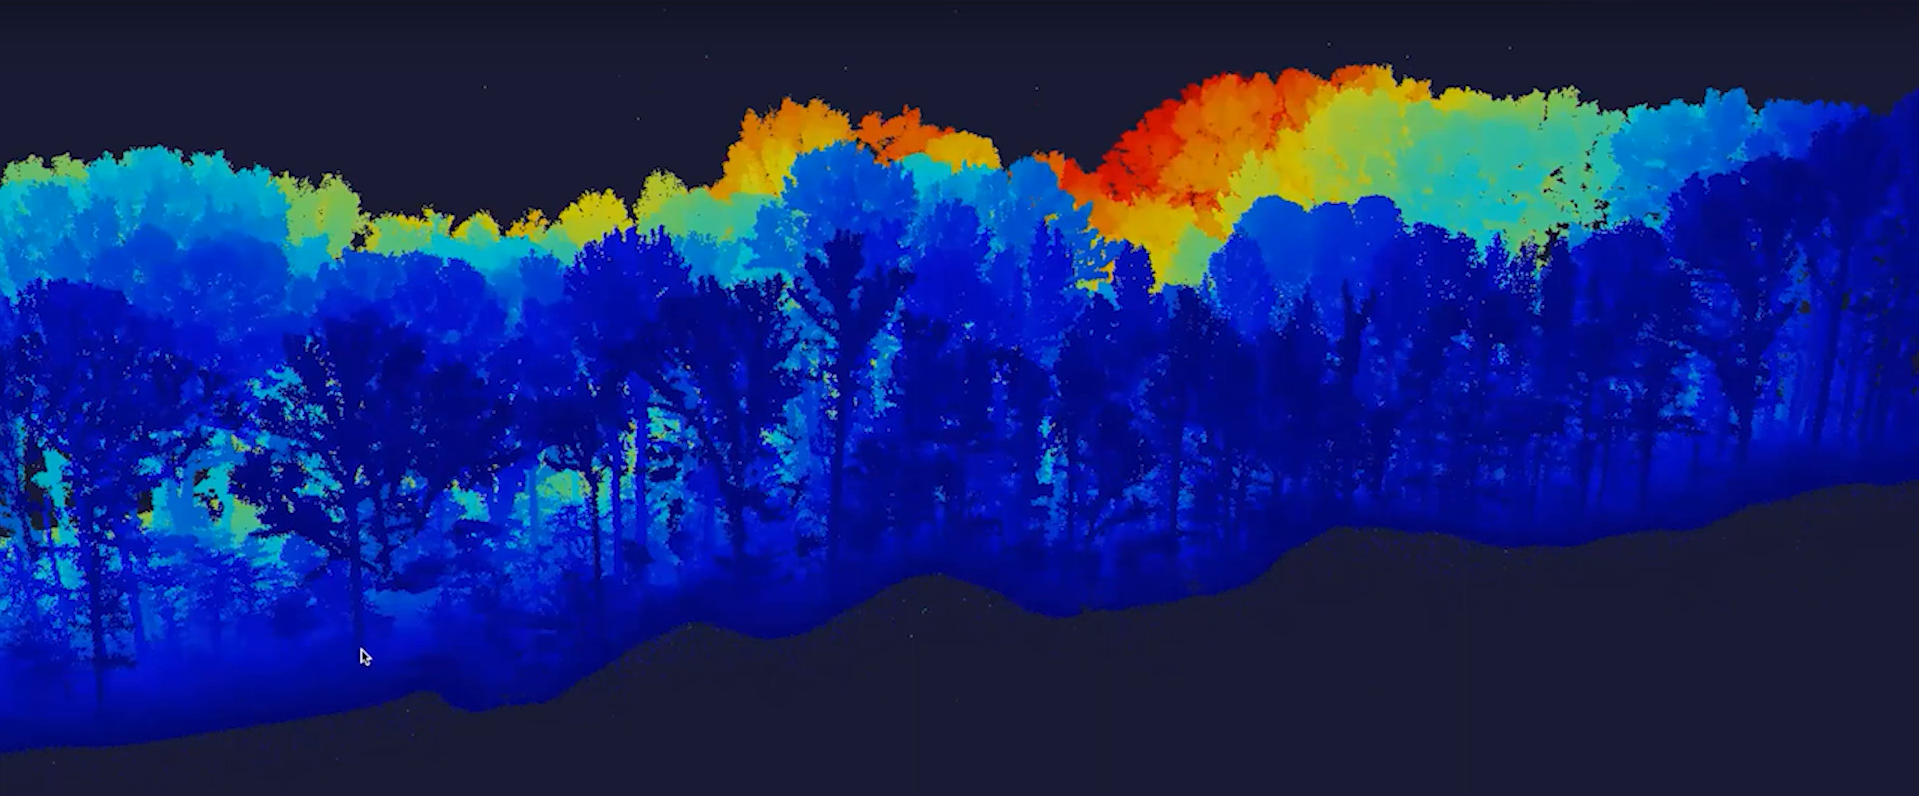
With precise forest structure and height information from lidar data it is possible to calculate sun exposure times and solar radiation.
The basic assumption on which plant area density estimation is based is that light attenuation is proportional to vegetation area density. (Vincent et al. 2023)
LiDAR can be a suitable tool for modeling solar radiation at various levels and producing continuous information across large forested areas with complicated structure and species composition. (A. S. Olpenda, Stereńczak, and Będkowski 2019)
light detection and ranging has, so far, been preferably used for modeling light under tree canopies. Laser system’s capability of generating 3D canopy structure at high spatial resolution makes it a reasonable choice as a source of spatial information about light condition in various parts of forest ecosystem. (A. Olpenda, Stereńczak, and Będkowski 2018)
structural metrics derived from Airborne Laser Scanning (ALS) data, serving as an empirical gold-standard in modelling subcanopy light regimes. a combination of Sentinel-1 and Sentinel-2 time series has the potential to map subcanopy light conditions spatially and temporally independent of the availability of high-resolution ALS data (Glasmann et al. 2023)
Single Photon Lidar under Forest Conditions
forest variables can be estimated with estimation accuracies similar or slightly higher using a single photon lidar system operated from high altitude (3800 m), compared to estimates from a conventional system, with the same point density but operated from low altitude (400 m). An advantage of the SPL100 system appears to be a better ability to penetrate dense canopies. (Wästlund et al. 2018)
(Brown, Hartzell, and Glennie 2020; Queinnec et al. 2022; J. C. White et al. 2021)
Geiger-mode Lidar under Forest Conditions
Near Real-Time Forest Monitoring
build on existing applications of ALS-derived enhanced inventories and integrate them with data from satellite constellations of free and open, analysis-ready moderate spatial resolution imagery (Nicholas C. Coops et al. 2023)
Lidar data in practice
A wall-to-wall forest attribute map was produced for all of Sweden. ALS data were combined with field data from the Swedish NFI. (Nilsson et al. 2017)
found height, aboveground biomass and volume to be the most commonly extended forest attributes, followed by canopy cover, basal area and stand complexity. (Nicholas C. Coops et al. 2021)
Beland et al. (2019) provide an overview on current and potential products derived from lidar data in the field of forest research. According to them, metrics for ground (slope and aspect), canopy height and canopy cover are operational products derived from ALS data and metrics on leaf area distribution, leaf area index, above ground biomass and aerodynamic parameters are operational but require further accuracy assessments.
processed the AHN3 point cloud (∼16 TB uncompressed data volume) into 10 m resolution raster layers of ecosystem structure at a national extent, using a novel high-throughput workflow called ‘Laserfarm’ and a cluster of virtual machines with fast central processing units, high memory nodes and associated big data storage for managing the large amount of files. The raster layers (available as GeoTIFF files) capture 25 LiDAR metrics of vegetation structure, including ecosystem height (e.g. 95th percentiles of normalized z), ecosystem cover (e.g. pulse penetration ratio, canopy cover, and density of vegetation points within defined height layers), and ecosystem structural complexity (e.g. skewness and variability of vertical vegetation point distribution). (Kissling et al. 2023)
https://www.wbv-nordschwarzwald.de/3d-forstinventur-projekt
Public relation
Apart from quantitative analyses lidar point clouds and derived products can also be used to communicate and vizualize information. A good example can be seen a movie about the project “Grünes Gallustal”, where ALS data was acquired to capture the city status. This digital twin was then enhanced with planned city developments to create a video for communicating the project ideas. One recent example where this has been done is the project Grünes Gallustal.
Lidar data is also used in documentaries to vizualize forests in other perspectives (e.g. The Giants)