About Lidar data
Lidar, or Light Detection and Ranging, is a remote sensing technology that uses laser pulses to measure the distance to an object or surface. The data collected by lidar systems is typically in the form of point clouds, which are a set of 3D coordinates representing the location of objects or surfaces in the environment. Lidar data can be used for a variety of applications, including mapping, surveying, navigation, and object detection. One of the key advantages of lidar is its ability to penetrate through obscurants such as fog, smoke and vegetation.
Types of Lidar platforms
Lidar sensors can be mounted on varoius platforms to fulfill different tasks in different environments at different scales.
Typical area coverage (adapted from Beland et al. (2019))
- TLS: 0.01-1 ha
- PLS: 0.25-5 ha
- MLS: 5-100 ha
- ULS: 0.02-10 km²
- ALS: 10-1000 km²
- SLS: global

Personal laser scanning (PLS)
Handheld laser scanning systems also referred to as personal Laser Scanning (PLS / H-PLS) systems emerged in recent years. As lidar sensors are getting smaller and cheaper there is even a lidar sensor built in the newest IPhone generation.
Terrestrial laser scanning (TLS)
This type of lidar is mounted on a tripod or other stationary platform, and is used to collect data from a specific location. It is commonly used in architectural and engineering applications. While the other systems are kinematic, TLS is a static system.
Mobile laser scanning (MLS)
This type of lidar is mounted on vehicles and is used to collect data while in motion. It is commonly used for mapping roads, bridges, and other transportation infrastructure.
Unmanned aerial vehicle laser scanning (ULS / UAVLS)
This type of lidar is mounted on unmanned aerial vehicles (UAV) and is used to collect data from above (low elevation) for small to medium areas.
Airborne laser scanning (ALS)
This type of lidar is mounted on aircraft and is used to collect data from large areas, such as entire cities or large forests. It is commonly used for mapping, land-use planning, and environmental monitoring.
Spaceborne laser scanning (SLS / SBL)
There are also lidar sensors equipped to platforms in the space. One of these spaceborne lidar missions is the global ecosystem dynamics investigation (GEDI), which is attached to the International Space Station to monitor biomass in tropical forests. Another lidar system in space is the ICESat-2 project, where the sensor is equipped to a satellite to measure polar ice thickness.

Types of Lidar sensors
Full Waveform Lidar / Linear-Mode Lidar
Full waveform lidar records the entire laser pulse as it reflects off a surface and returns to the sensor. This allows for more detailed measurements and analysis of the returned signal, such as the shape, width and amplitude of the returned pulse. This kind of Lidar is able to detect the presence of multiple surfaces and objects within the pulse’s path and can also provide information about the reflectivity, density and other properties of the target surfaces. It is commonly used in applications such as vegetation mapping, forest canopy height and high resolution mapping. Discrete-return lidar identifies and retains a number of ranges for which the reflected laser energy signal exceeds a threshold.
Geiger-Mode Lidar
Geiger-mode lidar systems use an array of avalanche photodiodes (APDs) to detect the incoming photons. Geiger-mode LIDAR provides only range information, not radiometric data, and is less accurate compared to full-waveform LIDAR. The technique has advantages in situations where rapid terrain acquisition from high altitude is required.
3DEO (2023):
- 30 km²/hour with high point density
- 10-30 million 3D measurements per second
- systems on a jet at 9000 m could map a swath on the ground 5 km wide, delivering 3D imagery at 30 cm resolution.
Harris (2015):
- 4 points per m² at 1200 km²/hour
- 8 points per m² at 1000 km²/hour
- 20 points per m² at 700 km²/hour
Single Photon Lidar
Single-photon lidar (SPL) uses a very short pulse of green (532 nm) laser light that is split into a 10 × 10 grid of beamlets with a diffractive optical element. Each beamlet has a low divergence of 0.08 mrad that results in non-overlapping footprints on the ground and is received by an individual detector aligned along its path. The system configuration allows an increase in both areal coverage and point density and a reduction in flying time and associated costs compared to conventional systems. The instrument is inherently sensitive to background solar noise when operated in daylight conditions, which requires subsequent noise filtering steps that could affect the accuracy of data. Moreover, the conventional intensity measure of the returns, which can be used for tree species characterization, cannot be derived similarly from single photon detection events. SPL still provides a proxy for intensity based on the cumulative count of detected photons although its range is limited (Coops et al. 2021).
Less flight strips are needed to cover the same area with comparable point density with SPL. SPL exhibits moderate vegetation penetration under leaf-on conditions (Mandlburger, Lehner, and Pfeifer 2019)
- laser pulse simultaneously emits a large number of mutually but non-overlapping sub-beams, each of which is assigned on the detector side an individual field of view aligned to its spatial direction
- uses laser radiation in the visible green range of the spectrum (wavelength λ=532 nm)

Software to process lidar data
Various
- WhiteboxTools “advanced open-source geospatial data analysis platform”
- LAStools “a collection of highly efficient, batch-scriptable, multicore command line tools to classify, tile, convert, filter, raster, triangulate, contour, clip, and polygonize LiDAR data”
- PDAL “C++ library for translating and manipulating point cloud data”
- CloudCompare “3D point cloud and mesh processing software”
- GRASS GIS GRASS GIS offers, besides other things, numerous analytical tools for point clouds
- QGIS supports Pointcloud processing (through PDAL)
- VOSTOK - The Voxel Octree Solar Toolkit command-line tool to compute a detailed model of incoming solar radiation distribution on a patch of land, including structures like buildings and vegetation, represented by a 3D point cloud data set
- Segment-lidar Python package for segmenting aerial LiDAR data using Segment-Anything Model (SAM) from Meta AI.
- LAPIS “an open-source program optimized for processing aerial lidar for forestry applications”
- TerraScan “TerraScan is the main application in the Terrasolid Software family for managing and processing all types of point clouds”
- FUSION “developed to help researchers understand, explore, and analyze LIDAR data”
- Laserchicken / Laserfarm Toolkit for handling point clouds created using airborne laser scanning (ALS).
- CODEM Multi-Modal Digital Elevation Model Registration
- SilviMetric open source library and set of command line utilities for extracting point cloud metrics into a TileDB database
RStats
- lidR package An R package for analysis of Airborne Laser Scanning (ALS) data (Roussel et al. 2020)
- lidRmetrics package Additional point cloud metrics to use with *_metric functions in lidR.
- rLIDAR package LiDAR Data Processing and Visualization
- canopyLazR package “R package to estimate leaf area density (LAD), leaf area index (LAI), and forest structural attributes from airborne LiDAR point clouds.”
- lidaRtRee package “R package providing functions for forest analysis using airborne laser scanning (lidar remote sensing) data.”
- ForestGapR package “An R Package for Airborne Laser Scanning-derived Tropical Forest Gaps Analysis”
- sgsR package “a structurally guided sampling toolbox for LiDAR-based forest inventories”
- ALSroads package “Road corrections and measurements from ALS data”
- Forest Structural Complexity Tool plot scale measurements to be extracted automatically from most high-resolution forest point clouds from a variety of sensor sources
- lasR R Package for Fast Airborne LiDAR Data Processing
- rlas R package to read and write las and laz files
Apps
- ForestScanner (Tatsumi, Yamaguchi, and Furuya 2022)
Lidar-based data products
Point Cloud Data
The “raw” LiDAR data product is collection of point data, made up by 3-dimensional (X, Y, Z) points (the location) with optional other attributes such as intensity, classification of features and GPS time. These point clouds can consist of millions to billions of points. The standard data format for point clouds is LAS or LAZ files. The LAS file format is a standard binary file format to store and interchange 3-d point cloud data and the LAZ file format is simply a compressed version of LAS. Other (older) file formats for point data include text files such as ASCII XYZ files. These non-binary formats are not very effective but unfortunately still used by many distributors. The latest LAS specification is LAS 1.4 (more information can be found at asprs.org).
Digital Elevation Model (DEM)
A Digital Elevation Model is a digital representation of the elevation of the Earth’s surface typically above mean sea level. There are two types of DEMs, Digital surface models and Digital Terrain models, briefly described below.
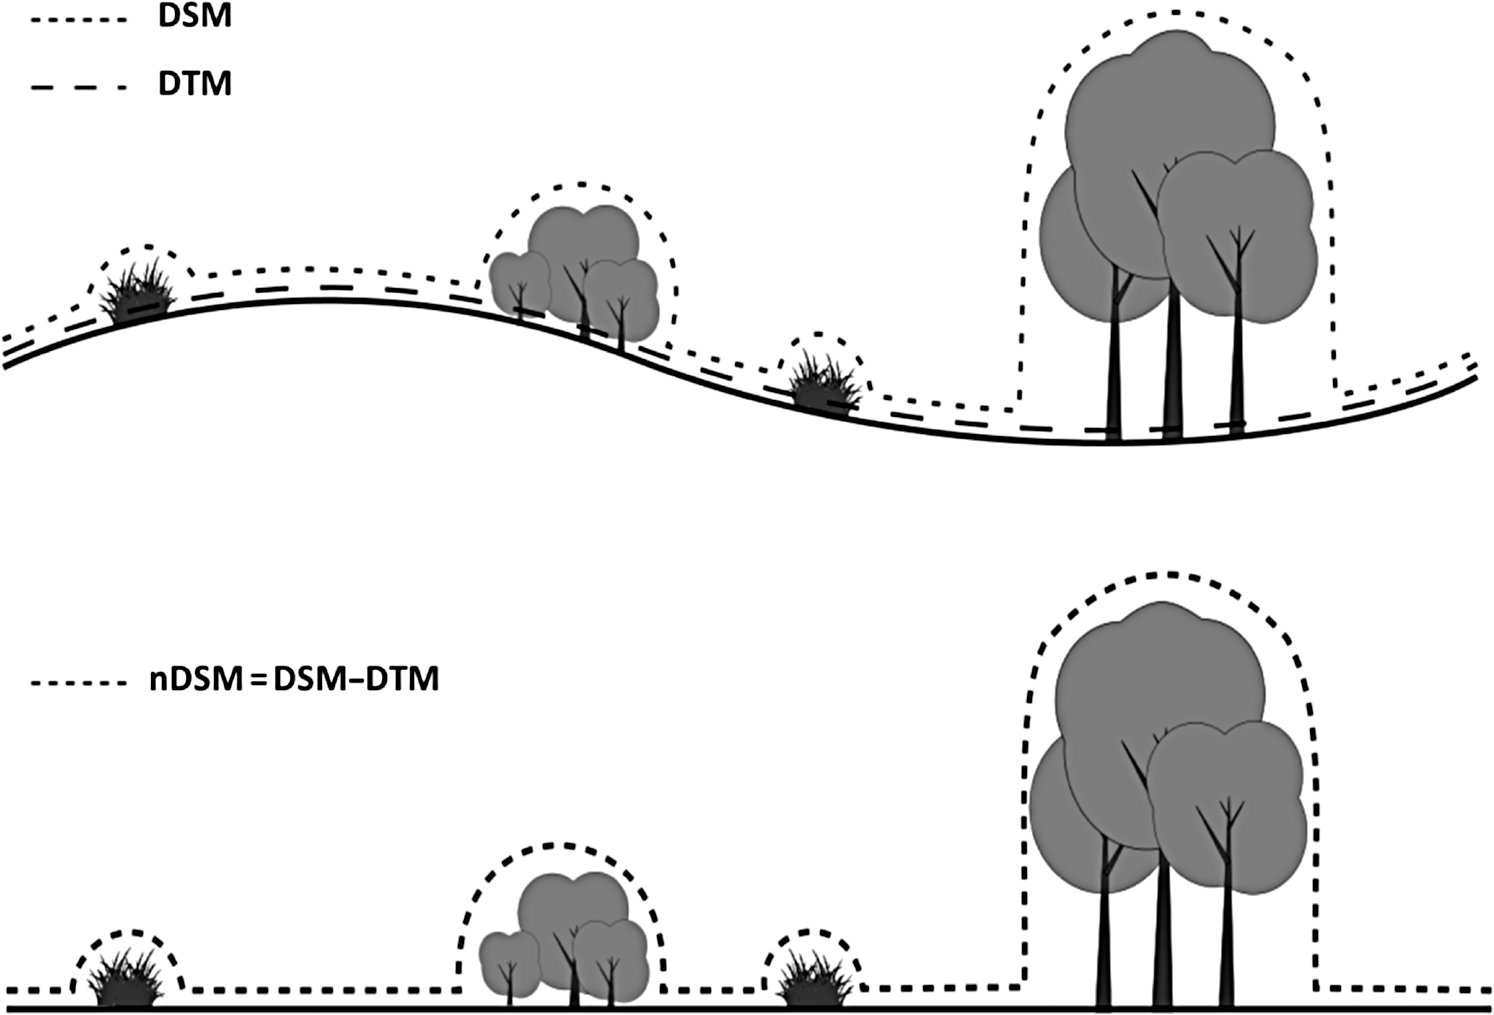
Digital Terrain Model (DTM)
A Digital Terrain Model approximates the continuous terrain surface by a set of discrete points with unique height values. The DTM does not include features like buildings or trees.
Digital Surface Model (DSM)
A Digital Surface Model is created by the interpolation of individual points containing the elevation characteristics of natural or human-made elements such as trees, buildings etc.
Canopy Height Model (CHM)
A Canopy Height Model is often referred to as a normalized surface model (nDSM). Sometimes, but not always, it is limited to vegetated areas (excluding buildings etc.).
Comparison to photogrammetry
Point clouds or height information in general can also be calculated from from overlapping optical images. Image-based point clouds, also known as photogrammetry point clouds, are created by using multiple images of a scene taken from different perspectives and using software to triangulate the position of objects or surfaces in the scene. This process is known as Structure from Motion (SfM).
There are several key differences between image-based point clouds and lidar-derived point clouds:
- Resolution: Lidar-derived point clouds typically have a higher resolution than image-based point clouds, especially in the z-axis (vertical direction). This is because lidar sensors are able to measure the distance to multiple objects if there are tiny gaps (e.g. in the canopy). Image-based point clouds usually only cover the upper-most layer since points in the lower layers typically cannot be seen and matched in multiple images (if they can be seen through a gap the angle for triangulation is very narrow which makes Z-estimations unprecise).
- Color: Image-based point clouds typically have color information associated with them, while lidar-derived point clouds do not. However, the color information can be added to the lidar point clouds by overlapping them with RGB imagery in postprocessing.
- Light condition: Lidar sensors are able to capture data in a wider range of lighting conditions than cameras, including in low light or complete darkness, while orthoimagery very much depends on the illumination conditions (sun, clouds, shadows, haze,…).
- Surface detection: Lidar sensors are able to detect surfaces that are difficult to see with cameras, such as surfaces that are very dark, very reflective, or very transparent.
Both techniques have their own advantages and disadvantages, and are often used together in applications such as mapping, surveying, and 3D modeling. Lidar data can be used to provide a highly accurate and detailed representation of the environment, while image-based data can provide information on the color and texture of surfaces.
Comparisons revealed that ALS metrics provided a more detailed characterization of the canopy surface including canopy openings. Change detection between ALS-derived CHM (time 1) and DSI-derived CHM (time 2) provided change estimates that demonstrated good agreement (r = 0.71) with two-date, ALS only, change outputs. For the single-layered, even-aged stands the DSI-derived vertical information is appropriate. ALS is more suitable for capturing stand density. (Vastaranta et al. 2013)
The coupling of DAP with ALS technologies will likely have the greatest impact on forest inventory practices in the next decade (J. C. White et al. 2016)
Digital airborne imagery is typically less costly to acquire than ALS, is well understood by inventory practitioners, and in addition to enabling the derivation of height information, allows for visual interpretation of attributes that are currently problematic to estimate from ALS (such as species, health status, and maturity). Image-based point clouds primarily characterize the outer envelope of the forest canopy, whereas ALS pulses penetrate the canopy and provide information on sub-canopy forest structure. (J. White et al. 2013)

Analyses comparing area-based estimates for DAP and ALS have found that accuracies can be considered analogous (although ALS data is generally more accurate), with DAP acquisitions being considerably less expensive relative to ALS. (Goodbody, Coops, and White 2019)
ALS produced significantly better estimations than the SfM metrics for all the variables of interest (Rodríguez-Vivancos et al. 2022)
research indicate the successful application of SfM photogrammetry in forestry, in an operational context and in research, delivering results that are comparable to LiDAR surveys. (Iglhaut et al. 2019)
both ALS and DAP models were suitable for predicting the five forest attributes in the five separate inventories, however ALS models performed better (Noordermeer et al. 2019)
Given the known quality and consistency of ALS-derived forest inventory attributes, these data are highly desired by forest managers and practitioners. The higher cost of ALS over photointerpretation-based forest inventory has meant that in some jurisdictions, ALS data are strategically obtained over areas of high interest or value. Such a calculated implementation strategy allows for the benefits of ALS-derived inventories to be captured over specific areas, while minimizing costs of data acquisition, processing and modelling, among other considerations. (Tompalski et al. 2021)
tree height, the results varied from an RMSE of 0.36 m for UAV-LiDAR data to 2.89 m for photogrammetric data acquired by an aircraft. (Ganz, Käber, and Adler 2019)
results illustrate DAP’s sensitivity to occlusions, mismatched tie points, and other optical challenges inherent to using structure-from-motion workflows in complex forest scenes. These under-documented constraints currently limit the technology’s capacity to fully characterize canopy structure. For now, we recommend that operational use of DAP in forests be limited to mapping large canopy openings, and area-based attributes that are well-documented in the literature. (Dietmaier et al. 2019)
Although lidar provided more accurate estimates of forest attributes across a range of forest conditions, this study shows that unpiloted aerial systems (UAS) digital aerial photogrammetry (DAP) models can accurately predict key forest attributes (Lamping et al. 2021)
Recent advances in computer sciences “demonstrate the potential of large-scale mapping and monitoring of tree height” from aerial imagery using U-NET (without overlap and image matching) (Wagner et al. 2023)
DAP data do not provide analogous results to ALS data for canopy gap detection and mapping in coastal temperate rainforests, and that ALS data enable markedly superior accuracy and detailed gap characterizations. (J. C. White et al. 2018)